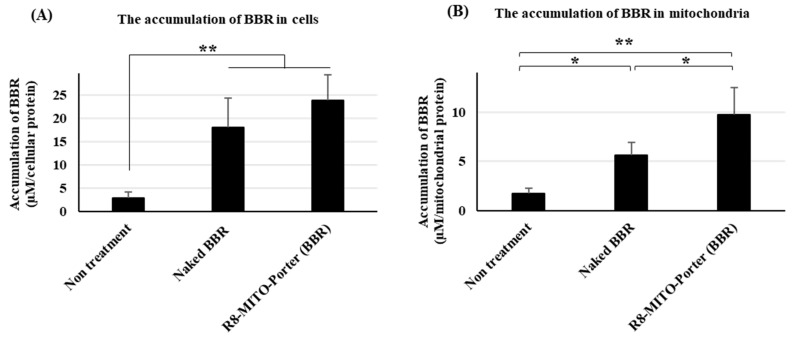
Figure 3.
Evaluation of the accumulation of BBR into cells and mitochondria. After treatment with these samples, the medium was replaced, and the resulting preparation was incubated for 4 h. Measurement of the concentration of BBR in cells and mitochondria. (A) BBR concentration in cells. (B) BBR concentration in mitochondria. Data are represented as the mean ± S.D. (n = 3). * p < 0.05, ** p < 0.01, one-way ANOVA followed by Student–Newman–Keuls test.

