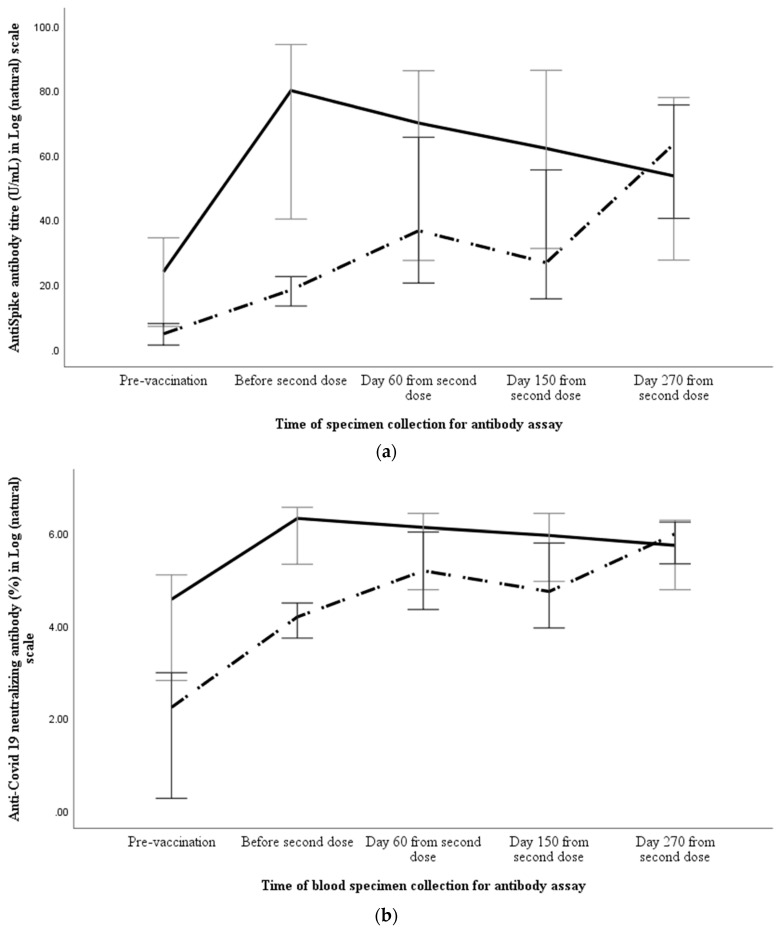
Figure 3.
Comparison of anti-spike antibody titre (a) and percentage of neutralising antibody (b) between those with (solid line) or without (broken line) detectable anti-spike antibody before vaccination. The anti-spike antibody and neutralising antibody results, along with 95% error bar, are shown in Log (natural) scale along the Y axis, whereas X axis shows the time of specimen collection.

