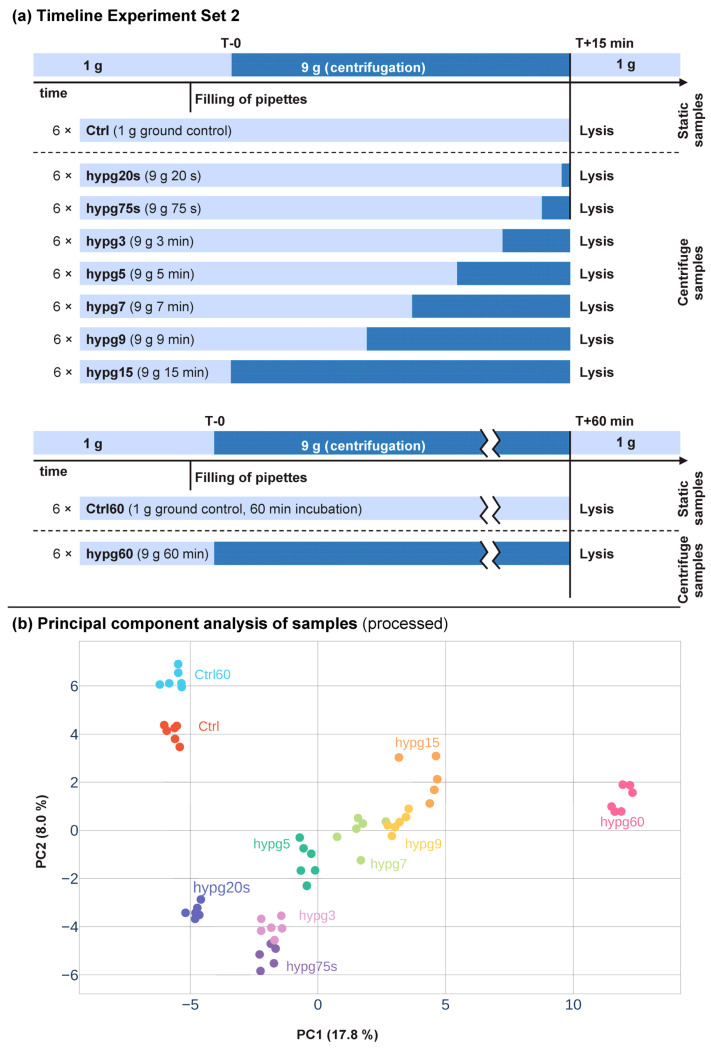
Figure 1.
Experiment overview. (a) Experiment fixation scheme. The experimental conditions from which samples were acquired are displayed. There were two experimental sets, one with 15 min incubation time, one with 60 min incubation time. For the first set, Jurkat T cells were filled into 1 mL pipettes, incubated for 15 min and then rapidly emerged into RLT lysis buffer. The set contained 8 sample groups, with 6 samples per group each. Ctrl was incubated for 15 min at 1 g gravity, hypg20s was incubated for 14 min 40 s at 1 g gravity and then exposed to 9 g for 20 s on a pipette centrifuge before lysis (indicated in dark blue), hypg75s for 13 min 45 s at 1 g and consequently 75 s at 9 g, hypg3 for 12 min at 1 g and 3 min at 9 g, hypg5 for 10 min at 1 g and 5 min at 9 g, hypg7 for 8 min at 1 g and 7 min at 9 g, hypg9 for 6 min at 1 g and 9 min at 9 g, and hypg15 for 15 min at 9 g. The second set contained the groups Ctrl60 that incubated at 1 g for 60 min and hypg60 that was continuously exposed to 9 g for 60 min. From Figure 2 on, comparisons between the hypg condition and Ctrl, resp. between hypg60 and Ctrl60, are named hypg20 s and so on. (b) Principal component analysis of gene counts for all samples. Counts were processed by surrogate variable analysis batch effect removal to exclude sequencing-specific noise and to promote clustering of sample group. Percent of explained variance is given per axis.

