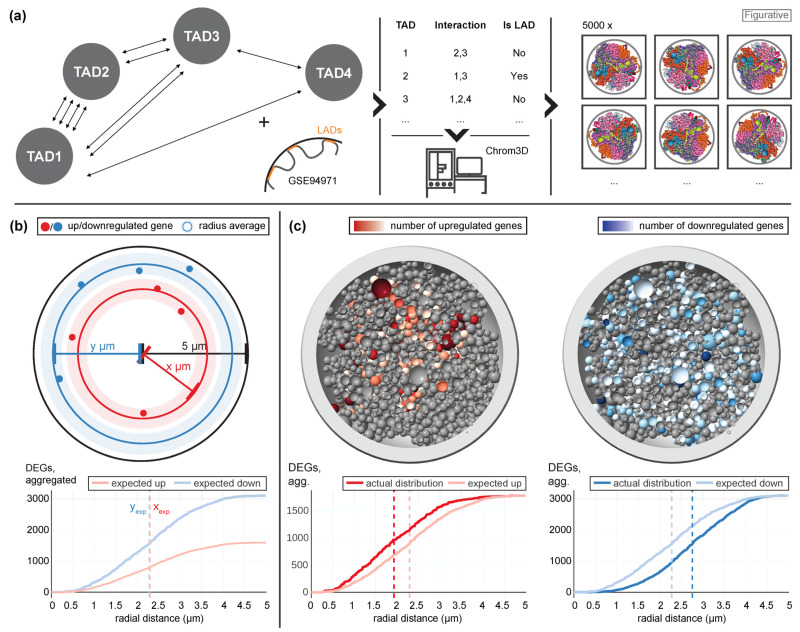
Figure 2.
Conceptualization of 3D gene distribution analysis. (a) Hi-C sequencing data from the 4th Swiss Parabolic Flight Campaign of Jurkat T cells were used to determine which topology-associated domains (TADs) interacted with each other. Additionally, lamina-associated domains of Jurkat T cells were utilized from the external GSE94971 data set. These two data sets were converted into a table, listing per TAD significantly interacting other TADs (implying proximity) and if this TAD is a LAD (increasing the probability to localize at the more remote parts of the nucleus). From this, the bioinformatic package Chrom3D calculated a set of 5000 potential 3D bead structures of the chromatin that fulfill the conditions from the table. These beads corresponded to TADs or continuous regions without TADs and could carry several genes. Integrity tests on the models can be found in Supplementary Figure S1. (b) Example of a 3D gene distribution analysis. For each gene, the radial distance to the nuclear center of the bead where the gene is located was determined. The expected distribution of differentially upregulated and downregulated genes (random drawing of genes from the set of all genes) and the actual distribution was analyzed. The average radius was calculated for the expected and the actual distribution of differentially upregulated/downregulated genes. In the diagram, the expected distributions of upregulated and downregulated genes are shown exemplary for the data set hypg15 of Experiment Set 1. The plot shows the number of differentially expressed genes (DEGs) that had a radial distance smaller or equal to the distance on the horizontal axis. The average distances (dashed lines) were the same for both expected distributions. (c) The actual distributions of significantly upregulated and downregulated genes are shown for the same data set as in (b). One example model of the generated 5000 models is displayed, the number of significantly upregulated or downregulated genes per bead is indicated by the color scheme. In the diagrams, the average distances of the actual distributions were shifted towards the expected average distances.

