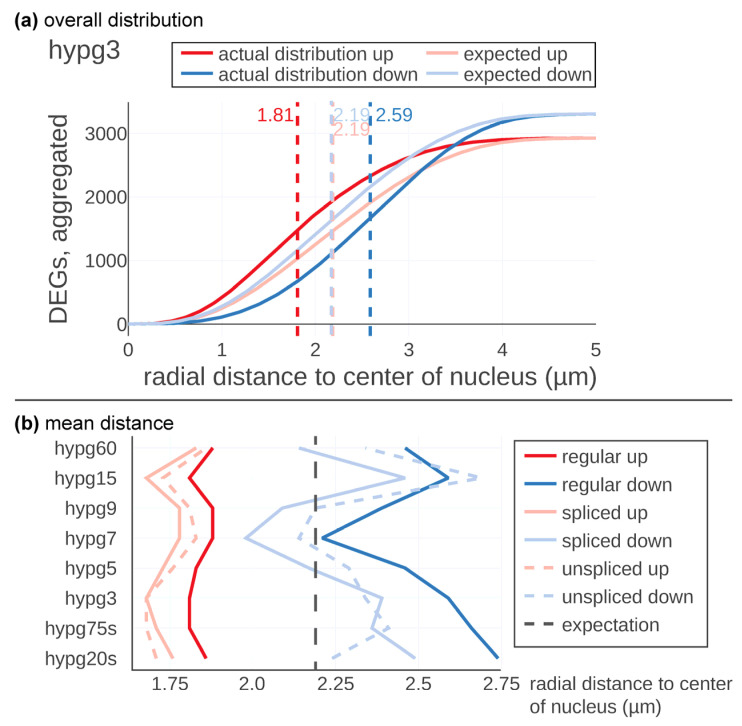
Figure 3.
3D gene distribution analysis of Experiment Set 2 data. (a) Detailed analysis for one comparison, hypg3. The expected average distance for both significantly upregulated and downregulated genes was 2.19 µm from the center of the nucleus. Upregulated genes tended to localize more in the center with an average of 1.81 µm, downregulated more remote with an average of 2.59 µm. (b) Average distance of significantly up- and downregulated genes for all comparisons, for the standard differential expression analysis (regular), and displayed separately for the spliced and unspliced transcriptome.

