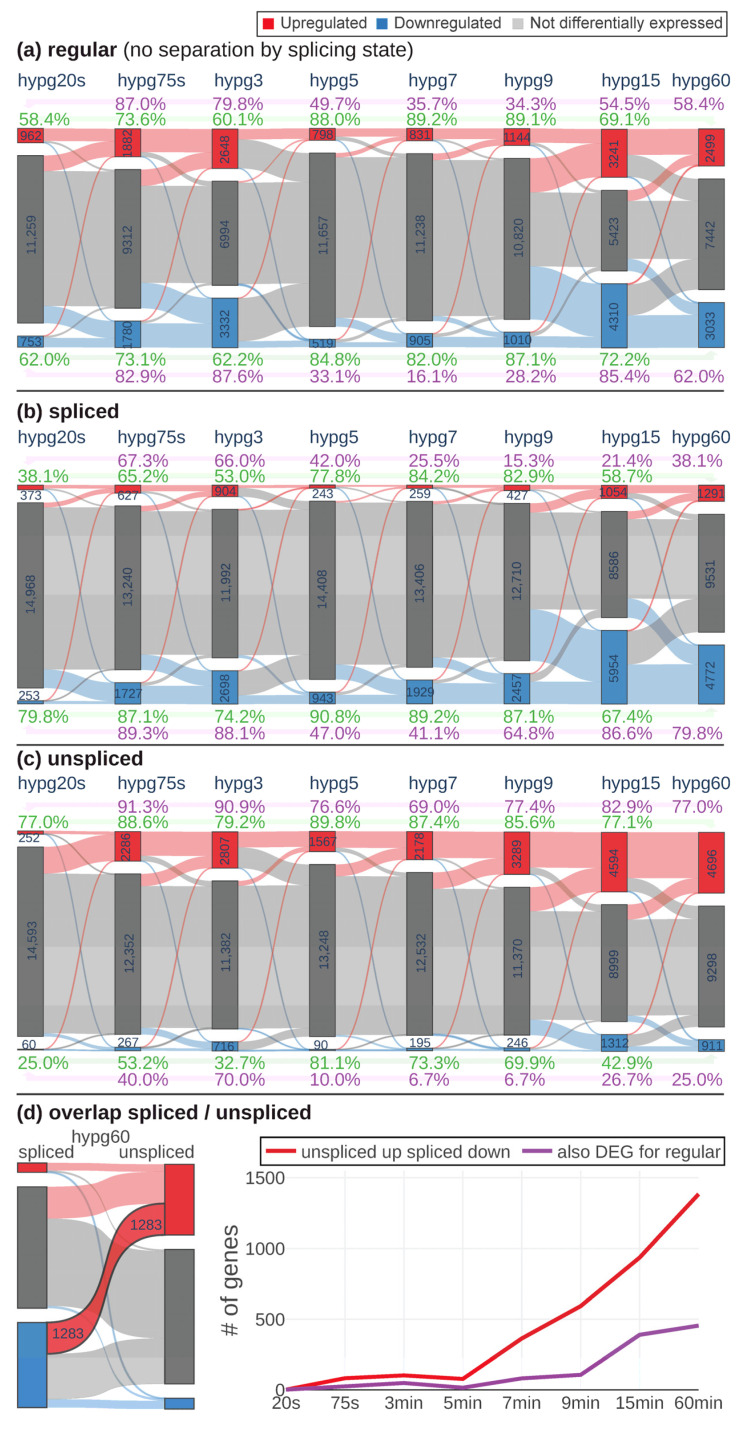
Figure 4.
Time course of differential expression. For each comparison, the number of significantly upregulated, downregulated and not differentially expressed genes is given. Flow bars between the comparisons indicate how many genes were regulated in a certain direction in the following comparison. Percent values indicate the coherence of differential gene expression in relation to hypg20s (purple) and hypg60 (green), separately for upregulated (above diagram) and downregulated (below diagram) genes: When comparing DEGs to the DEGs of the reference, it was calculated how many of the genes of the smaller group were differentially expressed in the same direction of the larger group. The overall analysis was performed on the regular transcriptome (a), the spliced transcriptome (b), and the unspliced transcriptome (c). (d) Some genes were significantly downregulated in the spliced transcriptome and upregulated in the unspliced, exemplary shown for hypg60. Not all of them were differentially expressed in the regular transcriptome. The number of “unspliced up spliced down” genes is displayed per comparison. Additionally, the fraction of these genes that were also differentially expressed for the regular transcriptome is displayed.

