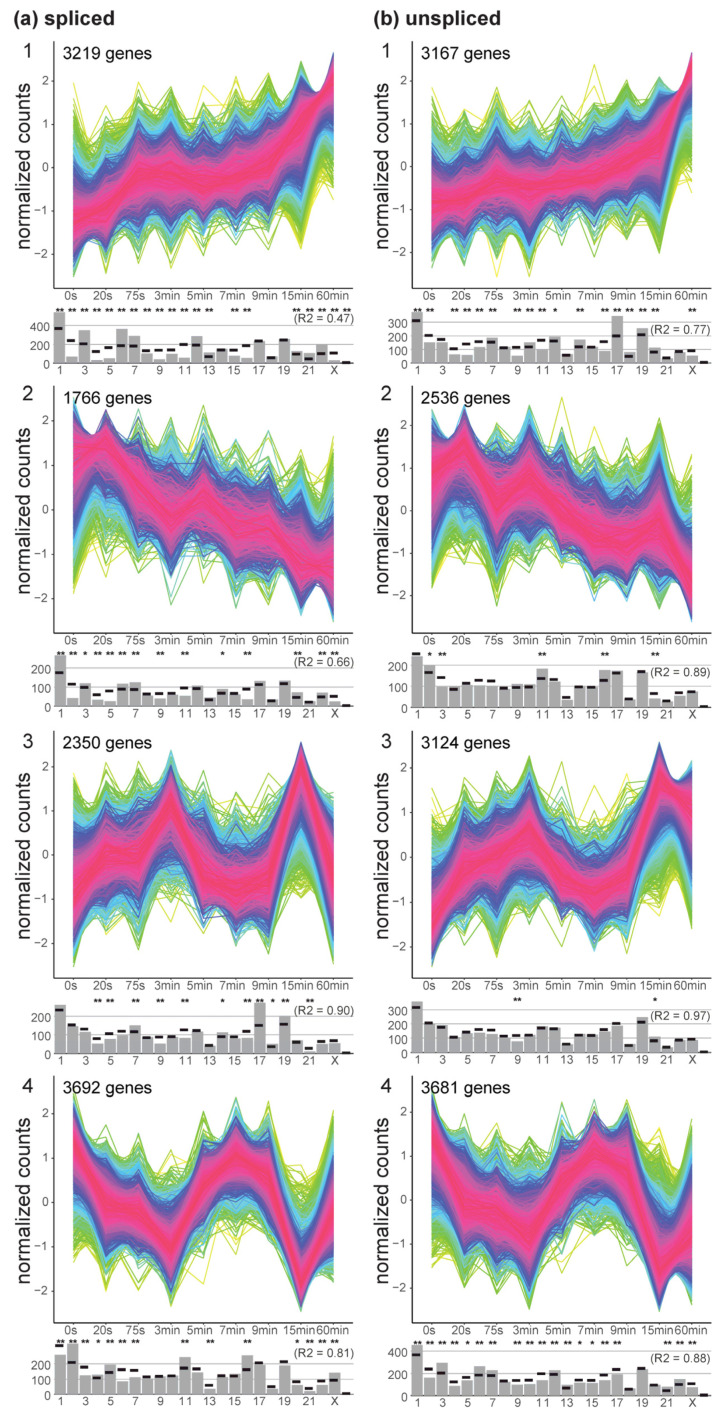
Figure 5.
Temporal analysis with time course tool TCseq. Significantly changing normalized gene count courses were clustered into groups. Normalized counts were plotted against all sample groups, ordered by their length. Four groups were selected for the analysis as the best compromise between complexity and homogeneity of groups. For each group (1–4), the density of genes is displayed by a rainbow pattern, with purple/red representing most time courses. The distribution over the chromosomes is given below each group, actual value as a grey bar, expectation by random drawing as black dash. Significant differences (adjusted p < 0.01/0.05) in localization are indicated by */**. The correlation coefficient between the expected and the actual number of genes per chromosome was given for each diagram, the smaller the number the larger the deviations from a random distribution. The analysis was separately performed for the spliced (a) and unspliced (b) transcriptome. Genes that are in time course group 1 for (a) are not necessarily in group 2 for (b).

