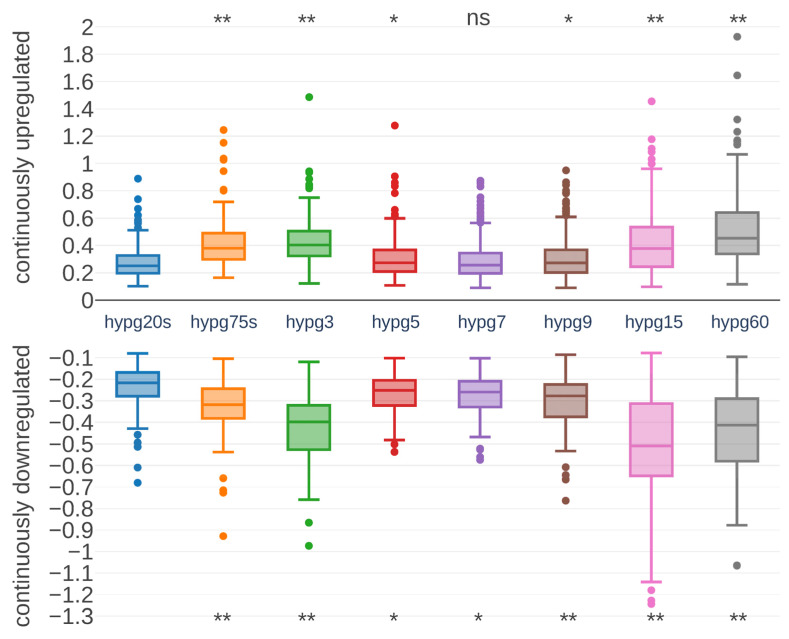
Figure 6.
Distribution of fold changes for continuously differentially expressed genes. Genes that had an adjusted p value below 0.05 for all comparisons and always showed a positive (upper part of the diagram) or negative (lower part) fold change were selected. The distribution of fold changes on the vertical axis is plotted as a boxplot for each comparison on the horizontal axis. Statistical differences between the hypg20s and later comparisons have been assessed by a t test. Significance levels, based on FDR-corrected p values, are indicated above/below each comparison (*: p-value below 0.05, **: p-value below 0.01).

