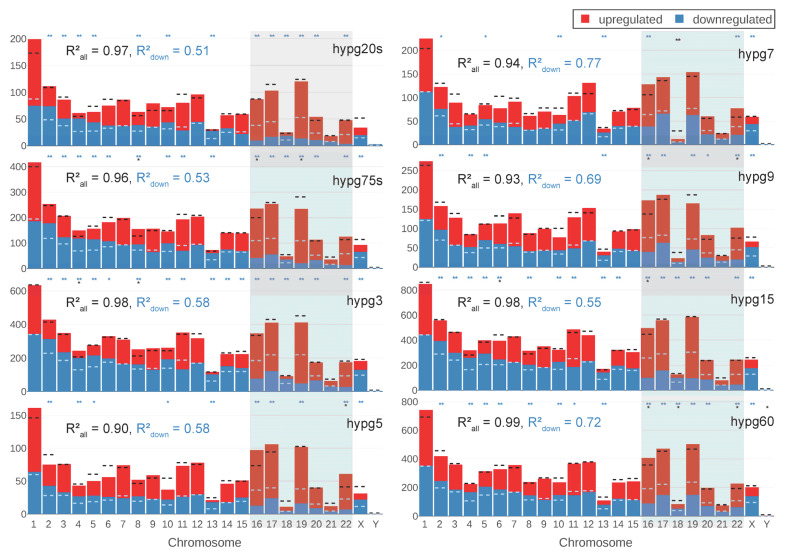
Figure 7.
Chromosomal distribution of differential gene expression. Number of differentially upregulated (red) and downregulated (blue) genes per chromosome (horizontal axis) for all comparisons. The expected number of total DEGs per chromosome (based on the fraction of differentially expressed genes for all genes and the number of detected genes per chromosome and assuming a uniform probability of differential expression) is shown as a black dashed line, the expected number of downregulated genes out of up- and downregulated genes is shown as dashed light blue line. If the difference between expectation and actual number of genes was so large that it could not be explained from random distribution, this was indicated above (* for adjusted p values < 0.05, ** for below < 0.02), both for absolute number of genes and distribution between up- and downregulation. The correlation coefficient between the expected and the actual number of total DEGs/upregulated genes was given. The closer the correlation coefficient comes to 1, the more the actual number corresponds to the expected number.

