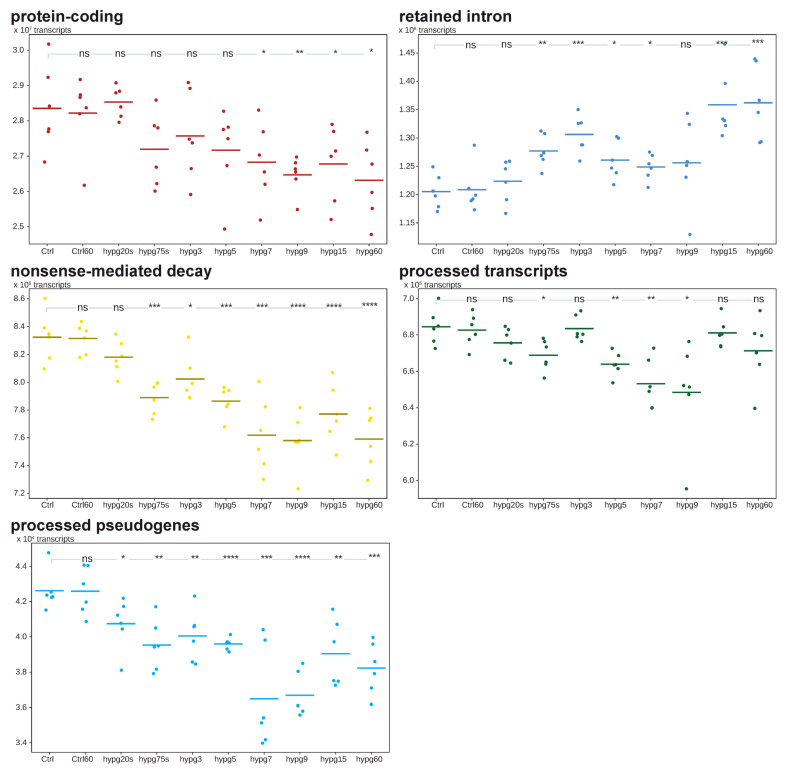
Figure 8.
Transcript distribution analysis. The data set was analyzed on the level of transcripts. The aggregated counts of the five most represented biotypes, protein-coding, retained intron, nonsense-mediated decay, processed transcripts (usually lacking an open reading frame) and processed pseudogenes (usually lacking an open reading frame) are shown. The sum of counts is shown for each sample, the averages of sample groups are indicated by dashes. In the top of each diagram, it is indicated if the differences between Ctrl and any other group is significant (* for adjusted p < 0.05, ** for adjusted p < 0.01, *** for adjusted p < 0.001, **** for adjusted p < 0.0001, based on Student’s t test) or not (ns).

