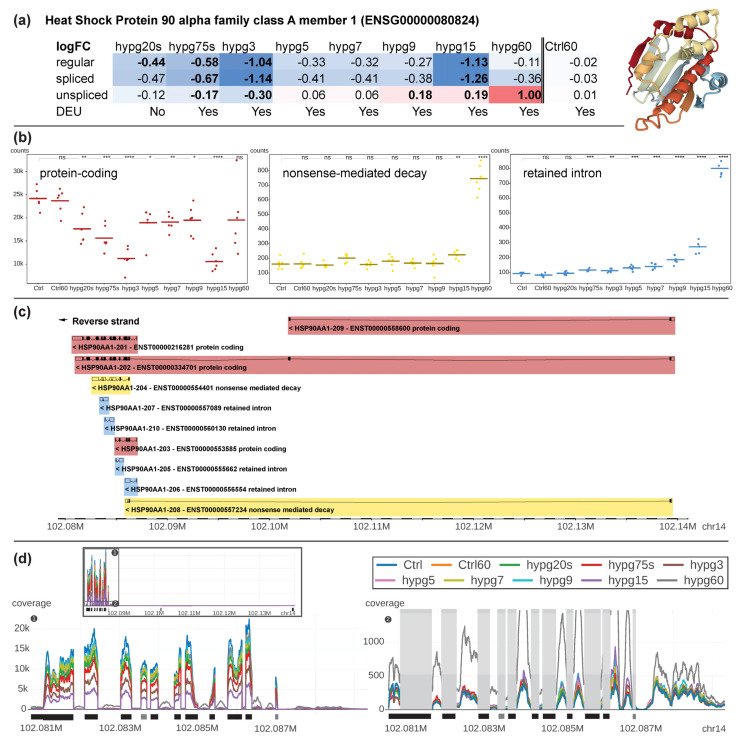
Figure 10.
Detailed analysis of HSP90AA1, the gene with multiple transcript isoforms that showed the strongest significantly differential expression while having more than 1000 counts in each condition. (a) Fold changes for each comparison for the regular, spliced and unspliced transcriptome. The fold change is continuously color-coded, with blue for downregulation, white for no differential expression and red for upregulation. Significant differential expression is indicated by bold font. The protein is displayed, based on PDB structure 1BYQ. (b) Transcript counts aggregated by transcript biotype per comparison. Each sample is represented by one point, sample group averages by dashes. Protein-coding contains the summarized counts of transcript variants ENST00000216281, ENST00000334701, ENST00000553585, and ENST00000558600, nonsense-mediated decay of ENST00000554401, and ENST00000557234, and retained intron of ENST00000557089, ENST00000560130, ENST00000555662, and ENST00000556554. (c) Distribution and structure of all transcripts of HSP90AA1. The gene is on the reverse strand; therefore, first exons are located on the right. (d) Sequencing coverage along the gene on chromosome 14. The upper box shows the entire gene, sub-plots 1 and 2 focus on the first part of the gene that carries most reads. Sub-plot 1 focusses on exonic regions. Sub-plot 2 hides the strongly covered exons (grey boxes) and focusses on the intronic regions. Coverage for different points in time is shown by different colors. Exon location is indicated by black boxes (main exons), the first grey exon corresponds to a nonsense-mediated decay transcript, the second to a retained intron transcript.

