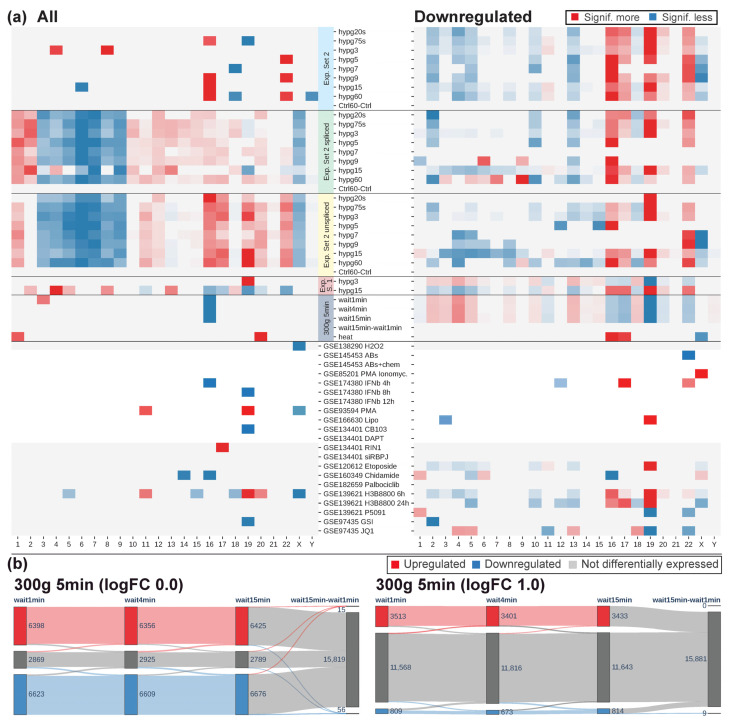
Figure 11.
(a) Chromosomal distribution analysis of all data sets from Table 1. The same analysis as in Figure 7 was performed. If for a chromosome, the difference between expectation and real distribution was significant (FDR-adjusted p value of Fisher’s exact test below 0.05), this was indicated by a blue box if significantly less and a red box if significantly more. The stronger the color, the smaller the p value. (b) Temporal coherence of the centrifugation study, 5 min centrifugation at 300 g with different waiting times: 1 min (as quickly as possible), 4 min, and 15 min. The samples were compared to a control that was not centrifuged, except for a direct comparison between 15 min and 1 min waiting time after 5 min of centrifugation. The analysis was performed at an FDR-corrected p value cutoff of <0.05, and a log fold change cutoff of 0.0 and 1.0, respectively.

