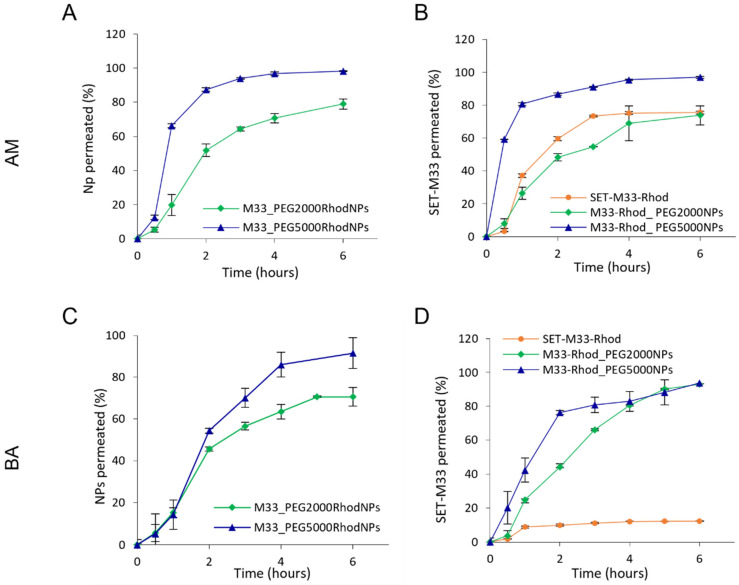
Figure 8.
In vitro transport of SET-M33-loaded fluorescent NPs (A,C) and in vitro transport of SET-M33_Rhod-loaded NPs (B,D) through artificial mucus (AM) and bacterial alginates (BA), as determined by the Transwell® multiplate assay. Results are presented as the percentage of SET-M33_Rhod and fluorescent NPs permeating across AM and BA as a function of time. Data are expressed as the mean ± SD calculated for three different batches (n = 6).

