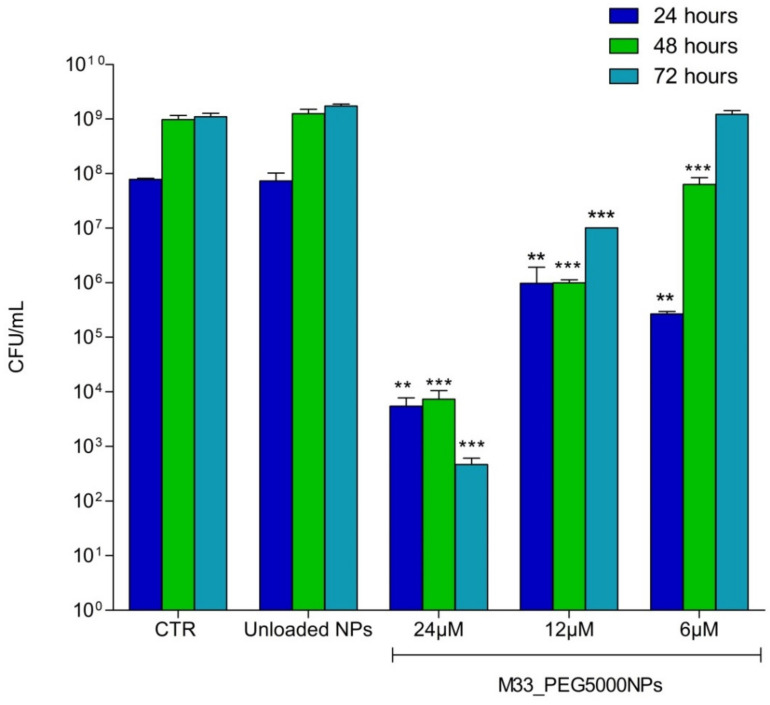
Figure 9.
Histogram of P. aeruginosa (ATCC 27853™) colonies (CFUs) produced at different times (indicated in the internal legend) and then plated in LB agar medium: CTR indicates the number of colonies produced by untreated bacteria. Unloaded NPs indicates the number of colonies produced by bacteria incubated with NPs without peptide. M33_PEG5000 NPs show the number of colonies produced by bacteria incubated with NPs with the peptide at the concentrations indicated. The experiment was performed in triplicate. Results are expressed as mean ± SD of three wells. Significant differences between groups were evaluated by one-way ANOVA with Dunnett’s multiple comparison test using GraphPad Prism 5.03 software, where ***, p < 0.001; **, p < 0.05. Each column is compared with its control at each time point.

