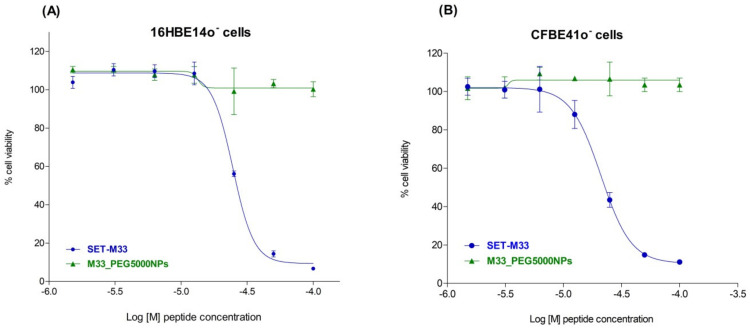
Figure 11.
Cytotoxicity of free SET-M33 (circle) and M33_PEG5000 NPs (triangle) towards 16HBE14o- (A) and CFBE41o- (B) bronchial cells: The cell lines were incubated with free and encapsulated peptide at the same concentrations (from 100 to 3.125 µM) for 48 h. Cell viability was then evaluated using 0.1% crystal violet staining solution. Cell survival (y-axis), expressed as a percentage with respect to untreated cells, is plotted against peptide concentration (x-axis) on a logarithmic scale. The experiment was performed in triplicate. The data, reported as mean ± SD (n = 3), were analyzed by non-linear regression using GraphPad Prism 5.03.

