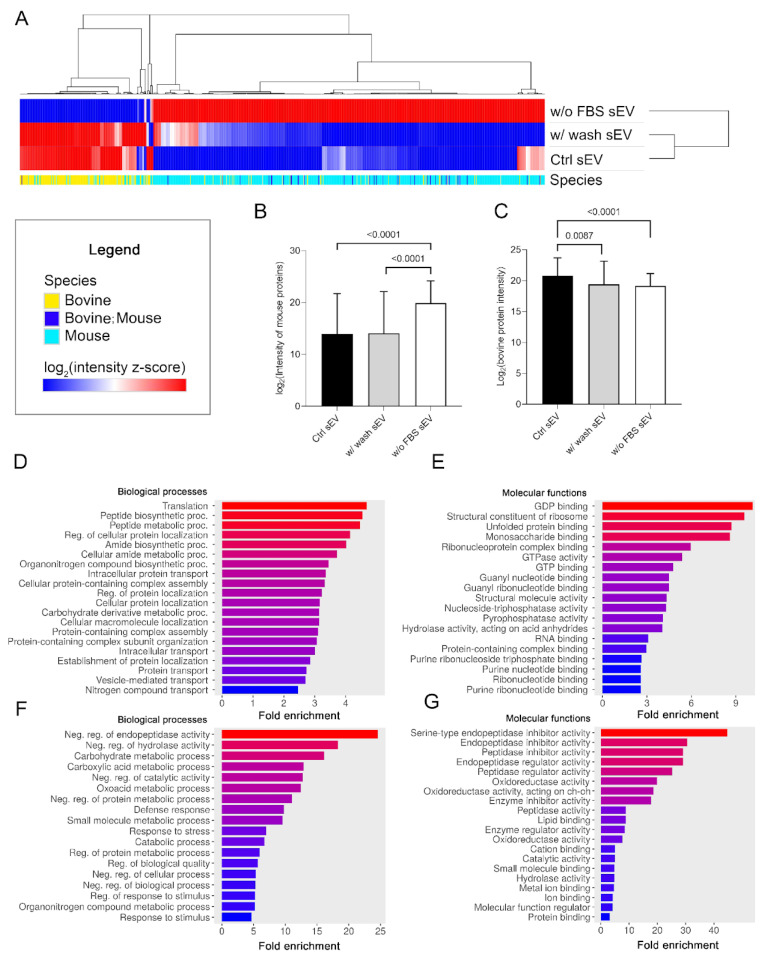
Figure 5.
Proteomic pattern and pathway enrichment analysis of the three sEV sample types. (A) Hierarchical clustering of the entire proteomic content of the three sEV sample types (columns indicate the proteins). (B) The boxplot shows logarithmized intensity of the mouse proteins (mean + SD) of the sEV samples derived from different culturing conditions and isolation procedures. (C) The boxplot shows logarithmized intensity of the bovine proteins (mean + SD) of the sEV samples derived from different culturing conditions and isolation procedures. The p values were obtained using Welch’s ANOVA followed by Games–Howell post hoc test. Bar charts show the top 20 GO terms for biological processes (D) and molecular functions (E)—ranked by fold enrichment—following analysis of mouse proteins identified in the Ctrl sEV sample. Bar charts show the top 20 GO terms for biological processes (F) and molecular functions (G)—ranked by fold enrichment—following analysis of Ctrl sEV-associated bovine proteins. Changing colors of the bars represent the decreasing fold enrichment values.

