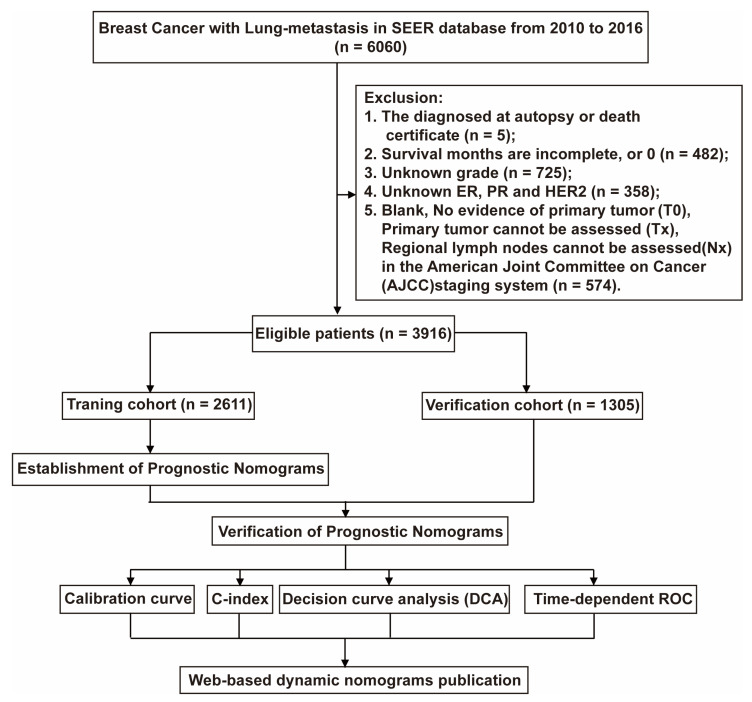
Figure 1.
The flowchart of patients was identified in the study. A total of 6060 BCML patients were included from the SEER database, and we excluded 2144 patients based on exclusion criteria. The 3916 patients who met the requirements were randomly divided into training and validation cohort by 2:1. The training cohort was used to construct Norman diagrams, and the validation cohort was used to evaluate the effect of the building model. We validated our constructed Norman plots using the Calibration curve, the C-index decision curve analysis (DAC), and time-dependent ROC methods.

