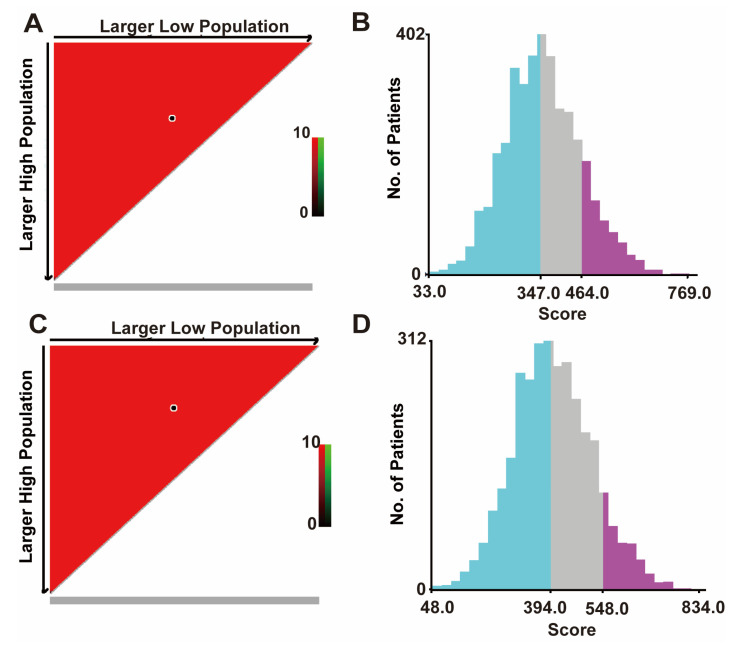
Figure 4.
The cut-off values were calculated using X-tile based on the total scores. (A) The black dot in the figure indicates the OS distinction point selected by X-tile software. (B) The cut-off values of OS are 347 and 464. The blue color is the low-risk group, the gray color is the medium-risk group, and the purple color is the high-risk group. (C) The black dots in the figure represent the CSS distinguishing points selected by X-tile software. (D) The cut-off values of CSS are 394 and 548. OS, overall survival; the blue color is the low-risk group, the gray color is the medium-risk group, and the purple color is the high-risk group. CSS, cancer-specific survival. All patients under our group price adjustment are under the OS, CSS curve.

