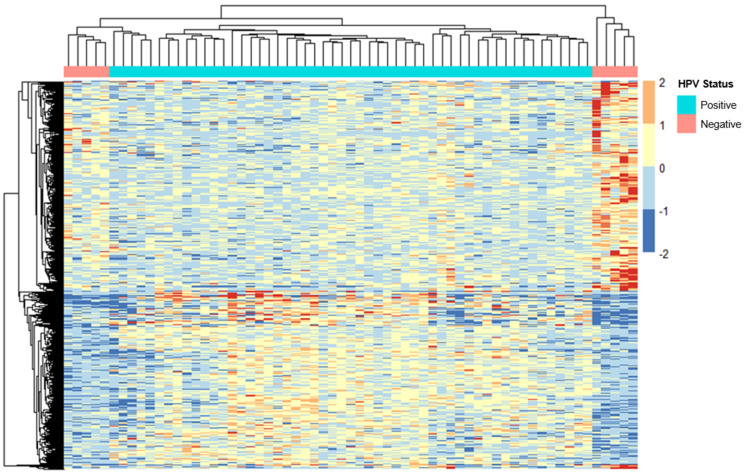
Figure 3.
Transcriptome analysis of ERVs in HPV-positive and -negative cervical cancer patients. Heatmap generated using the normalized expression values for ERVs from the Human Endogenous Retrovirus database (HERVd). The plot above depicts the most significant ERVs (padj < 0.1) that were differentially expressed among samples with differing HPV diagnoses. The plot above depicts the most significant ERVs (padj < 0.1) that were differentially expressed among samples of different HPV status, i.e., positive (n = 53) and negative (n = 10). A complete list of differentially expressed ERVs is displayed in Supplementary Table S5. ERV expression is indicated by color intensity from −2.0 to 2.0 on a log scale; red indicates ERVs with higher expression, and blue indicates ERVs with lower expression. HPV = human papillomavirus.

