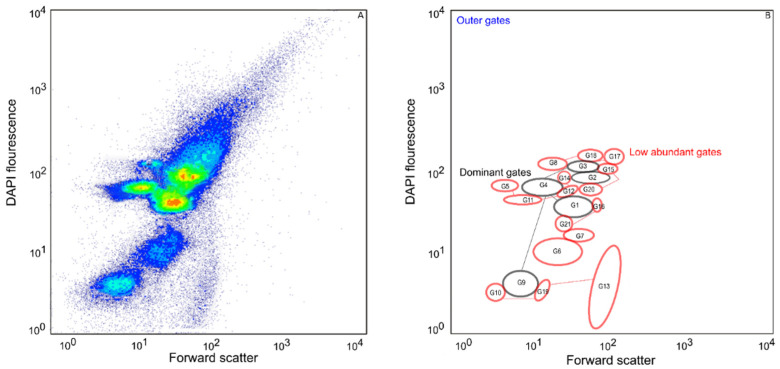
Figure 1.
Visualization of microbial community dynamics. (A) Microbial community analysis based on fluorescence signals of cells. (B) Representation of gates for separated sub-communities. Dominant gates are delimited with black color (116,796 cells), low abundant gates are delimited with red color (56,776 cells) and outer cells are not in the delimited gate.

