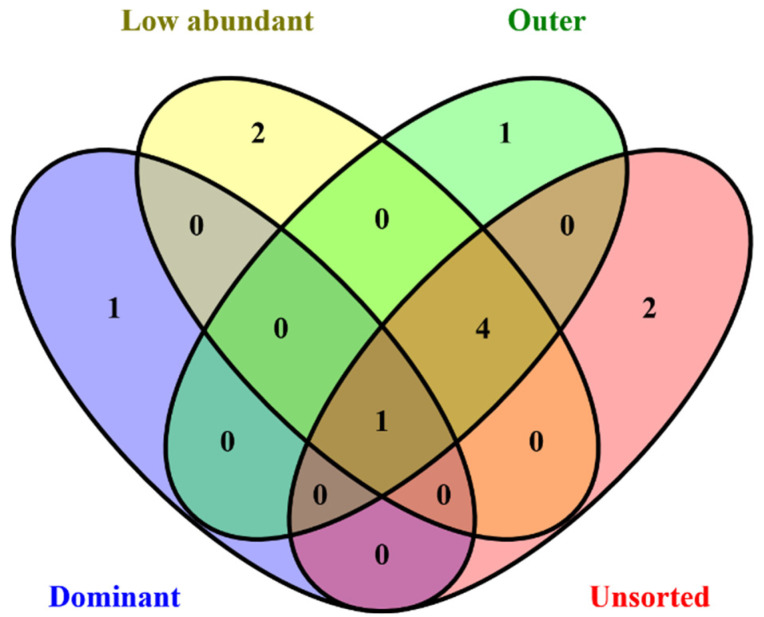
Figure 3.
Venn diagram depicting the number of taxa observed shared between representative MAGs. It presents the number of taxa observed between MAGs recovered from unsorted and sorted sub-communities. One taxon was present in both the unsorted community and sorted sub-communities. Four taxa were found in the unsorted community and a combination of one or more sub-communities. Two taxa were present only in the unsorted community and five were exclusively found in the sorted sub-communities.

