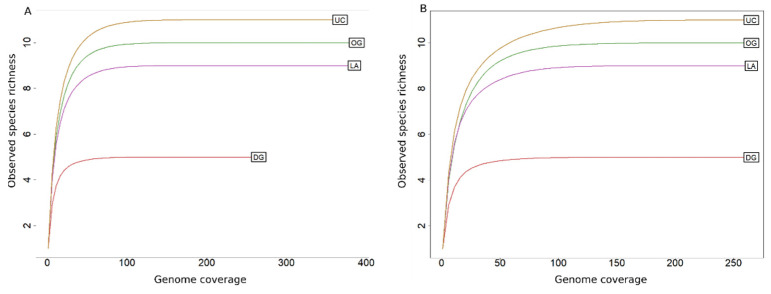
Figure 4.
Rarefaction curves showing the observed time coverages of species in unsorted and sorted sub-communities. Reads were transformed to coverage before plotting the curves. (UC: Unsorted community; OG: Outer sub-community; LA: Low abundant sub-community; DG: Dominant sub-community; (A): before rarefaction; (B): after rarefying the data to 265 times genome coverage).

