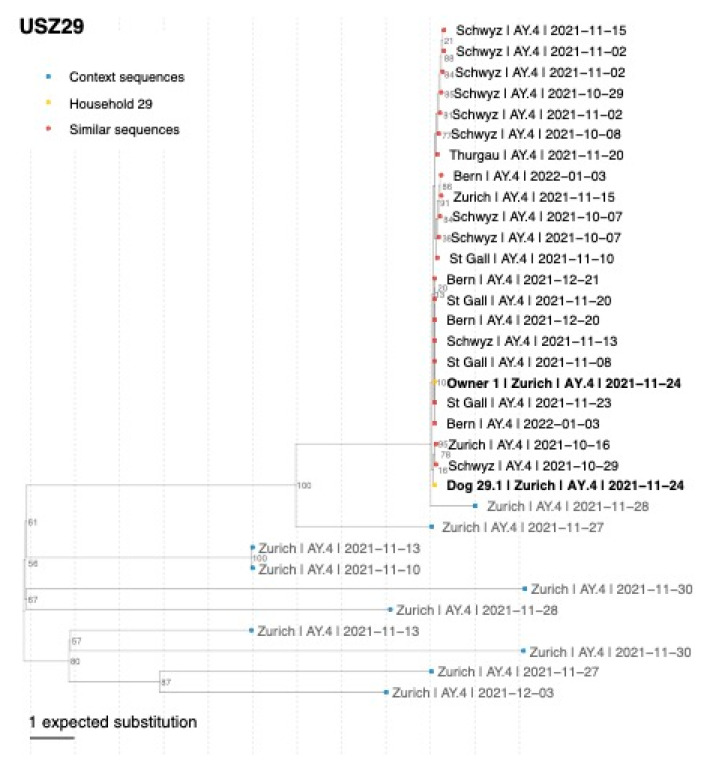
Figure A3.
Maximum-likelihood phylogenetic tree showing the relationship between the two sequences of USZ29 (yellow dots and bold text) and their respective 10 most genetically similar Swiss sequences obtained from GISAID. The most similar sequences (red dots) are defined as those with the smaller number of SNPs differences to each household sequence (sequences that are part of the 10 closest sequences for several of the household sequences only appear once in the tree). Blue dots indicate a representative set of 10 sequences circulating in Zurich in November–December 2021 from pangolin lineage AY.4 (context sequences). Location, pangolin lineage, and collection date are shown for each sequence. Bootstrap values for the internal nodes are shown next to each node from 10,000 bootstrap replicates.

