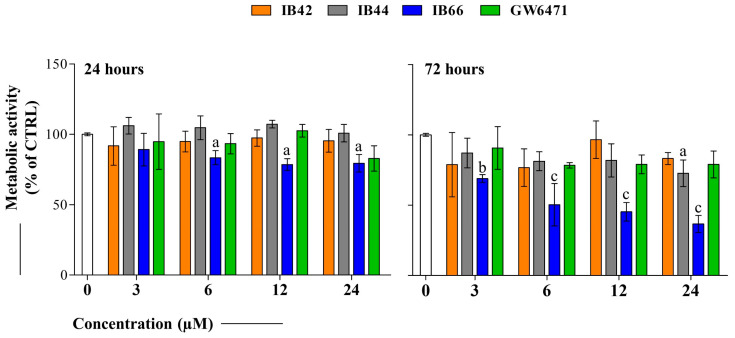
Figure 2.
Cell metabolic activity of MCF7 cells in the presence of phenylsulfonimide derivatives. Bar graphs represent the cell percentage of metabolically active cells in the presence of increasing concentrations (0–3–6–12–24 µM) of IB42, IB44, IB66, and GW6471 after 24 and 72 h of exposure. Optical density readings in untreated cultures (0 µM) were set to 100%. Bars show mean values ± standard deviations summarized from individual values in independent experiments (n = 6). Lower case letters indicate significant differences between untreated cell cultures (0 µM) and treated samples: a (p < 0.01), b (p < 0.001), and c (p < 0.0001). CTRL = 0 µM.

