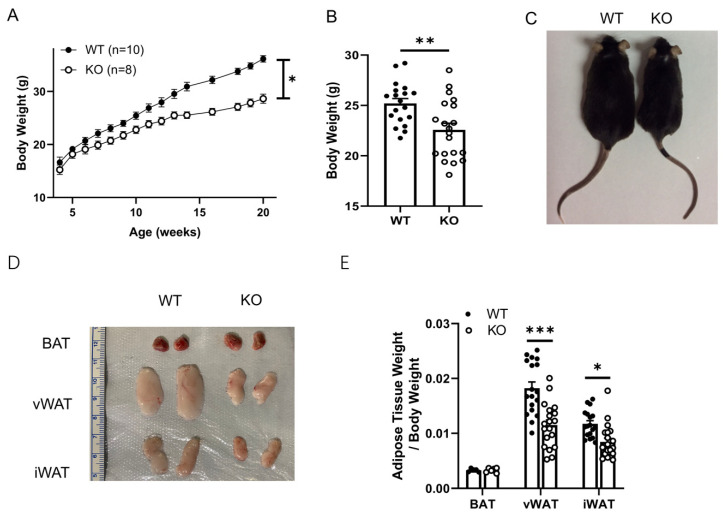
Figure 1.
SPL KO mice showed smaller body weights and WAT mass compared to littermate controls. (A). Average body weights of SPL KO (KO, n = 8) and wild-type littermate controls (WT, n = 10) at different ages. (B). Body weights and (C) representative photo of SPL KO and WT mice at 10 weeks of age. (D). Represent micrograph of BAT, vWAT, and iWAT of SPL KO and WT at 10 weeks of age (E). Adipose tissue weight/body weights of SPL KO and WT mice. B & E: n = 19–21 per group. Unpaired Student’s t-test was performed to compare the difference between WT and KO. * p < 0.05, ** p < 0.01, and *** p < 0.001. All data are presented as means ± SEM.

