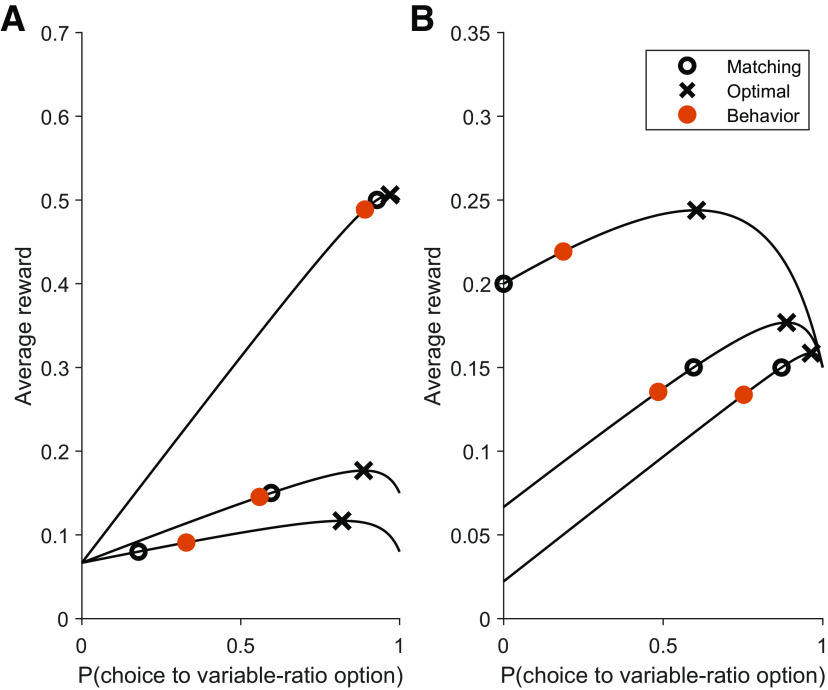
Figure 2.
Rats are systematically biased toward undermatching instead of the optimal probabilistic policy. A, In the study by Williams (1985), rats performed 6 different VI/VR task variants. Each black line demonstrates Vπ for each task variant. Overlaid on each Vπ line are X symbols for the optimal solution, O symbols for the matching solution, and filled orange circles for the empirical behavior. Rats were consistently closer to matching than to maximizing, and demonstrated a significant degree of undermatching. Because a choice of the VI option resulted in a 6 s time-out, we approximated the reward probability of the VI option by 6/τ, where τ is the mean reward time under the VI schedule. The schedules are defined as follows, where each number corresponds to pi, the base reward probability. VI/VR, from top to bottom: (0.07, 0.5), (0.07, 0.15), (0.07, 0.08). B, VI/VR, from top to bottom: (0.2, 0.15), (0.07, 0.15), (0.02, 0.15).

