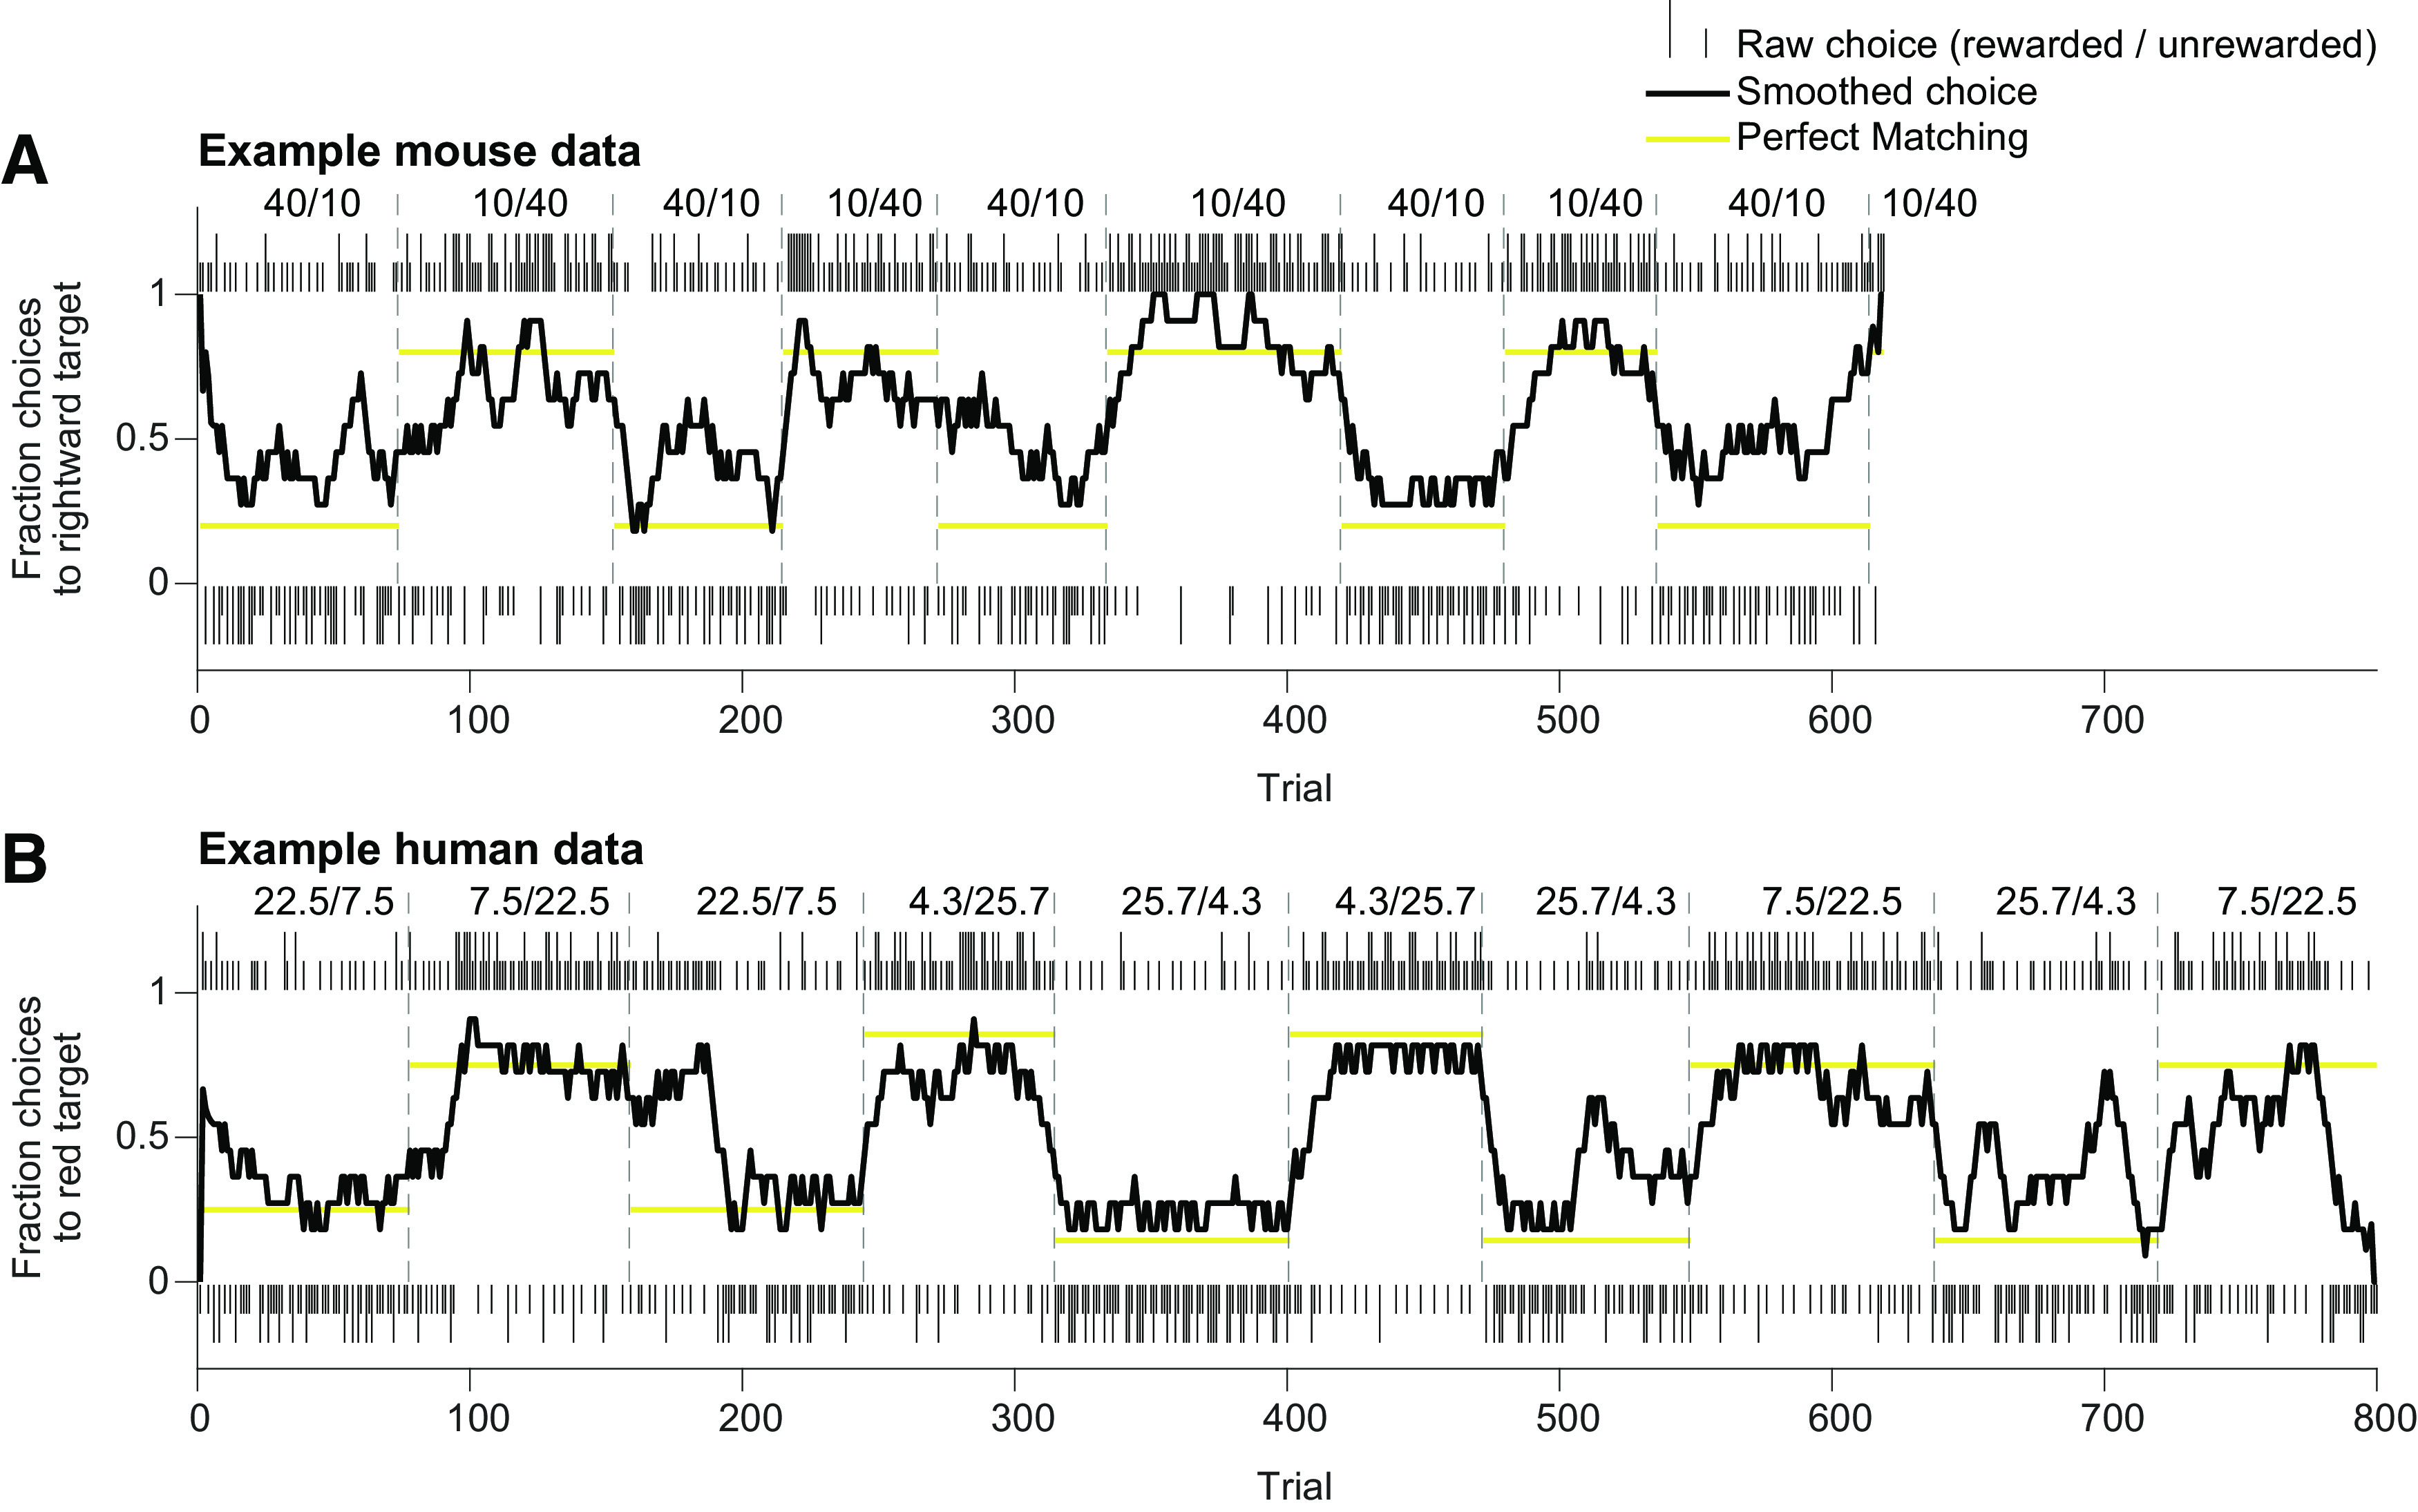
Figure 4.

Raw mouse and human behavioral data. A, Example mouse behavior in the “40/10” task variant. Tall (rewarded) and short (unrewarded) ticks correspond to leftward (below) and rightward (above) choices on individual trials. Dashed lines denote unsigned block transitions. Choices were smoothed with an 11-trial boxcar filter. Gold lines correspond to perfect matching behavior. Numbers indicate base reward probabilities for leftward and rightward choices. B, Example human behavior. Ticks correspond to green target (below) and red target (above) choices on individual trials. Numbers indicate base reward probabilities for green and red target choices.
