Figure 6.
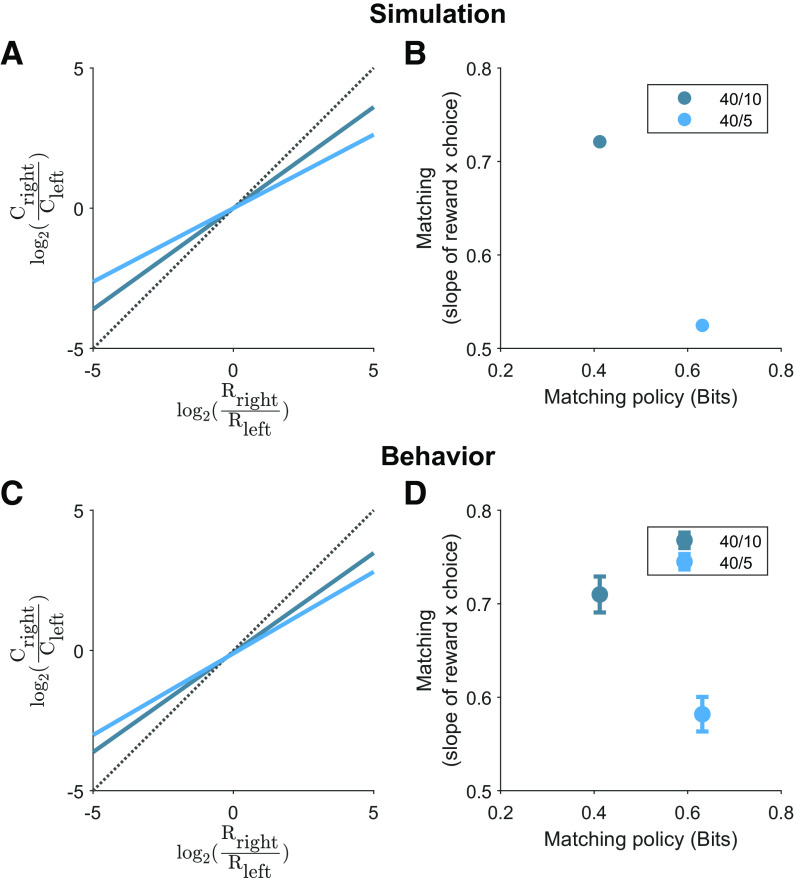
Mice exhibit greater undermatching in task variants that demand greater policy complexity. A, Simulation of a policy at a capacity constraint of 0.19 bits. The log-choice ratio is plotted as a function of log-reward ratio. Dotted line corresponds to unity. B, Theoretical matching slopes as a function of the policy complexity for perfect matching. C, Log-choice ratio as a function of log-reward ratio for the 40/10 (slope = 0.710) and 40/5 (slope = 0.582) task variants. Each colored line is the best fit and dotted line corresponds to unity. D, Empirical matching slopes (least-squares estimate ± 95% CI) for each task variant. 95% CIs: 0.691–0.729 for 40/10 task variant; 0.563–0.600 for 40/5 task variant. These data are significantly different as the 95% CI bands do not overlap.

