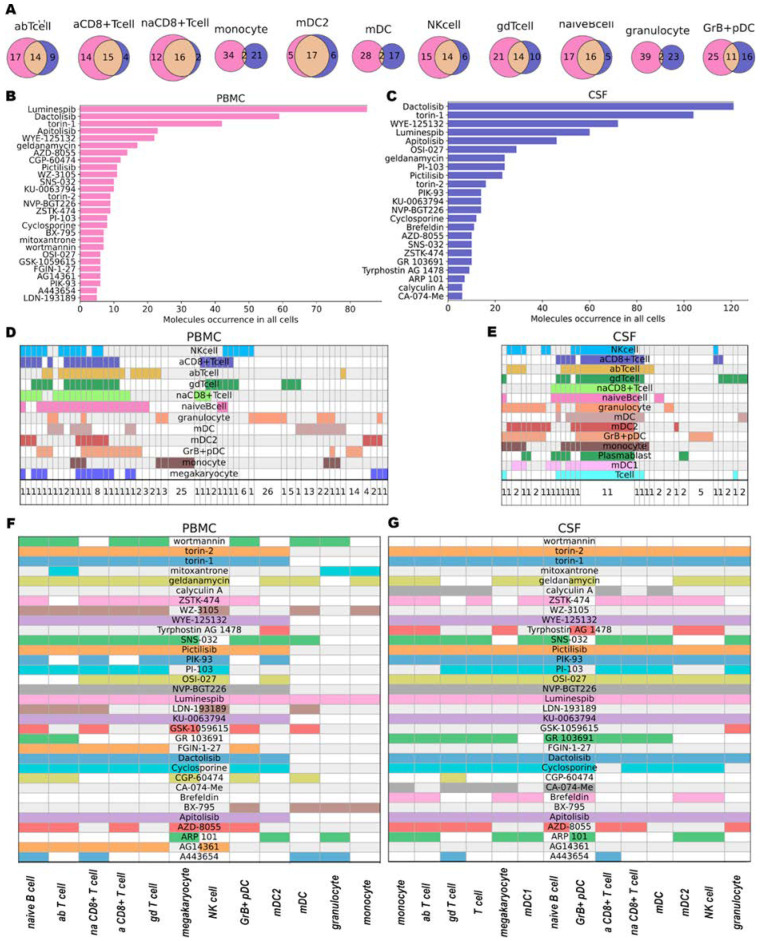
Figure 2.
Small molecules results (A): Intersections of the same cell types in PBMC (purple) and CSF (blue). (B,C): Occurrence of molecules in CSF (C) and PBMC (B) in all cell types. For visualization, we used only molecules that occur more than five times. (D,E): Intersection of agents obtained for each cell type in tissue (PBMC—(D), CSF—(E). Each column represents a group of small molecules (their number is provided at the bottom of the plot). Groups were created and sorted based on intersections of small molecules between cell types (rows). (F,G): Plots of the occurrence of molecules in the found cell types in PBMC (F) and CSF (G).

