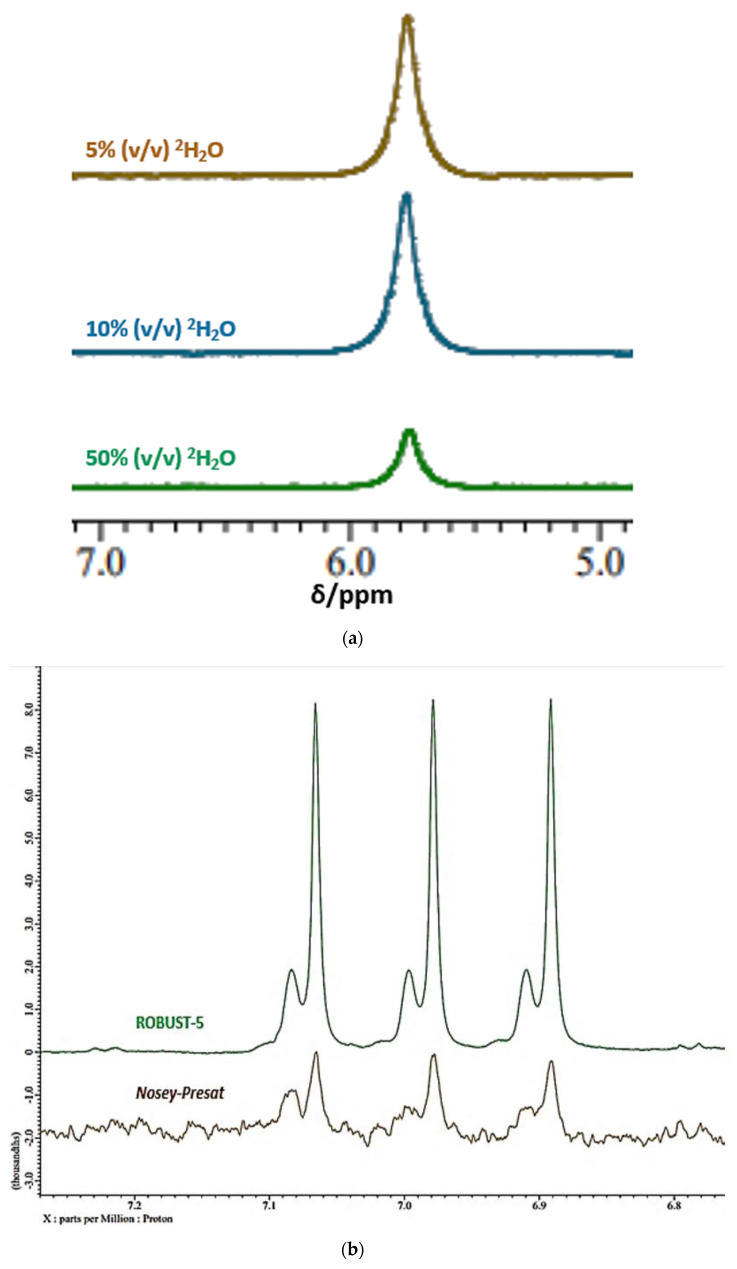
Figure 2.
(a) 1H NMR spectra of urea at increasing added % (v/v) 2H2O solution contents. Shown are the 4.90–7.10 ppm regions of spectra of 10.00 mmol./L urea acquired in solutions containing 5 (brown), 10 (blue) and 50% (v/v) 2H2O (green) using the Robust-5 pulse sequence. Samples also contained 10.00 mmol./L phosphate buffer (pH 7.00), and were equilibrated for a minimum duration of 1.0 h at ambient temperature (22 °C) prior to 1H NMR analysis. Spectra were obtained on a Jeol JNM-ECZ600R/S1 NMR spectrometer operating at a frequency of 600.17 MHz. Acquisition parameters were: sweep width 9 kHz; 16,384 data points; relaxation delay 1.0 s; 128 transients; and sweep width of 11,218 Hz. Broad urea resonance intensities were normalised to that of a TSP internal standard (final added concentration 125 µmol./L), with a chemical shift reference value set at δ = 0.00 ppm. Triplicate determinations were made for each 2H2O content, and typical spectra are shown. Estimated mean ± SEM ‘NMR-visible’ urea concentrations for these triplicate test solutions were 3.18 ± 0.020 mmol./L for 5% (v/v) 2H2O; 2.95 ± 0.021 mmol./L for 10% (v/v) 2H2O; and 1.28 ± 0.022 mmol./L for 50% (v/v) 2H2O. (b) Direct 1H NMR analysis of ammonia as ammonium ion in human saliva. Displayed are the 6.76–7.27 ppm regions of a WMSS sample showing signals emanating from the exchangeable protons of ammonium ion (NH4+) in aqueous acidic solution (final pH value 2.00) containing 10% (v/v) 2H2O, and using either the ROBUST-5 (green) or nosey-presat (brown) pulse sequences (pH values were adjusted with added HCl). Typical spectra are shown. The spectrometer utilised, and the spectral acquisition parameters involved were those given in (a) above. Resonance chemical shift values and intensities were normalised to that of a TSP internal standard (δ = 0.00 ppm). For this sample, the NH4+ ion concentration was estimated to be 7.60 mmol./L by application of a standard additions method.

