Figure 6.
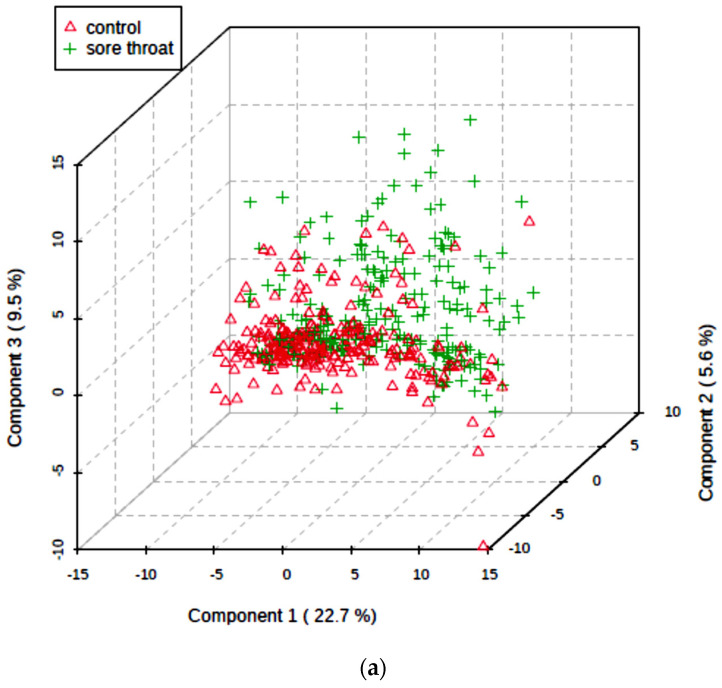
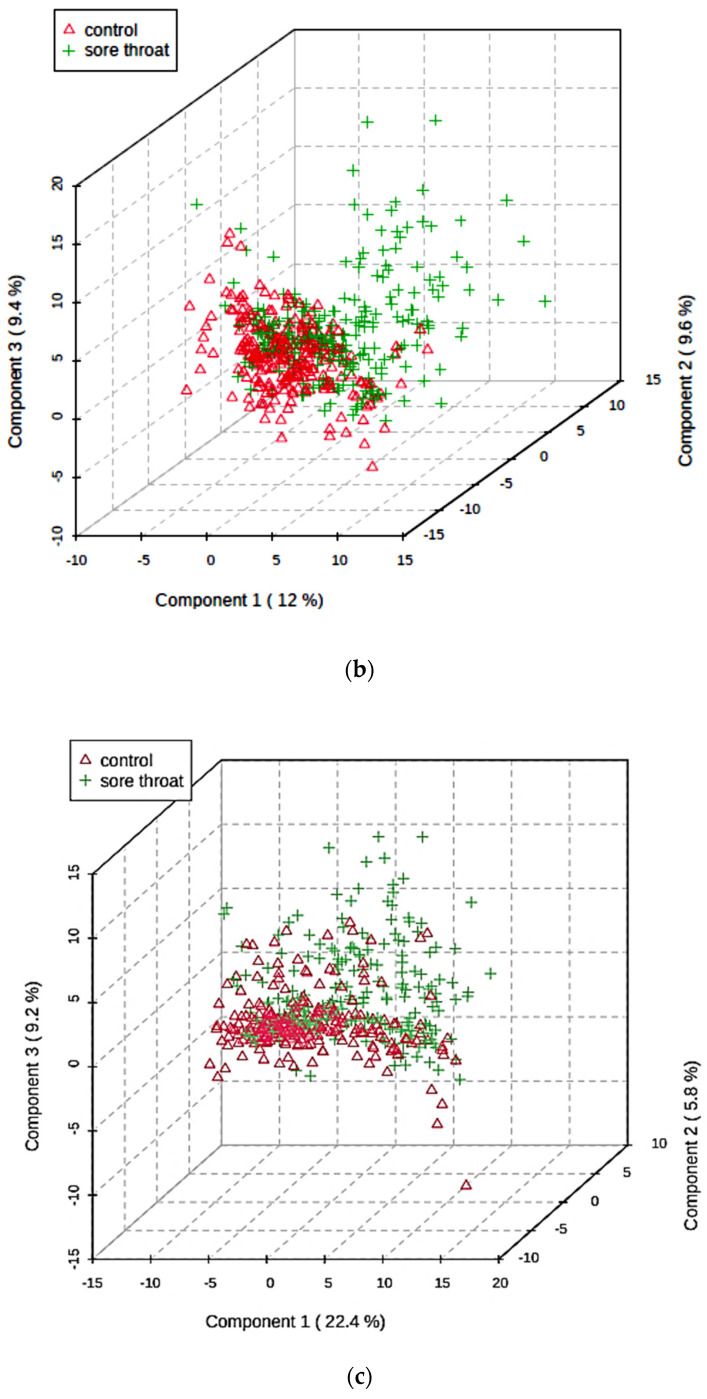
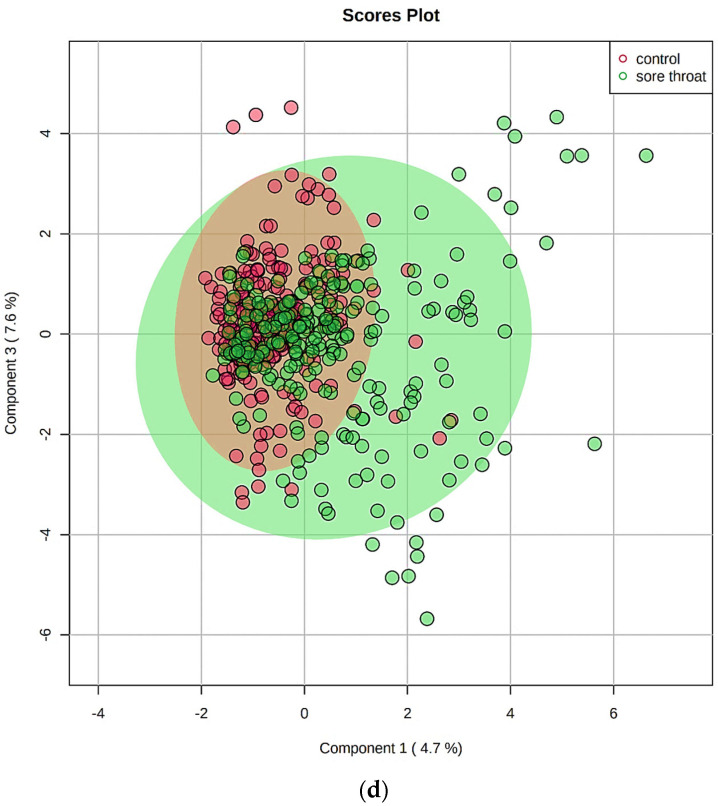
(a,b) 3D component 3 vs. component 2 vs. component 1 PLS-DA scores plots of the TSP-normalised 1H NMR WMS supernatant dataset for exploring distinctions between participants with an acute sore throat condition (green crosses) and those in an age-matched healthy control cohort (red triangles); in total, 240 samples from each group were analysed, i.e., 5 sequentially collected daily samples from each of 48 participants per group. A total of 31 assigned and named biomolecule predictor variables were incorporated into this experimental design (Model 1). In (a), row-wise product quotient normalisation (PQN), with glog-transformation and column-wise Pareto-scaling were applied prior to analysis; (b) as (a), but with constant sum normalisation (CSN) applied in place of PQN. The % variance contributions for each PC are indicated for each model. (c) as (a), but with 183 ISB variables. (d) 2D component 3 vs. component 1 sPLS-DA scores plot of the complete 183 ISB variable 1H NMR dataset for a model featuring 10 ISB predictor variables per component for a maximum number of 4 components (PQN, glog-transformation and Pareto-scaling were all applied to the MV dataset prior to analysis). This sPLS-DA analysis provided a high level of evidence for two separate sub-clusters of the sore throat group, one separate from the healthy control classification, the other appearing to co-cluster with it.


