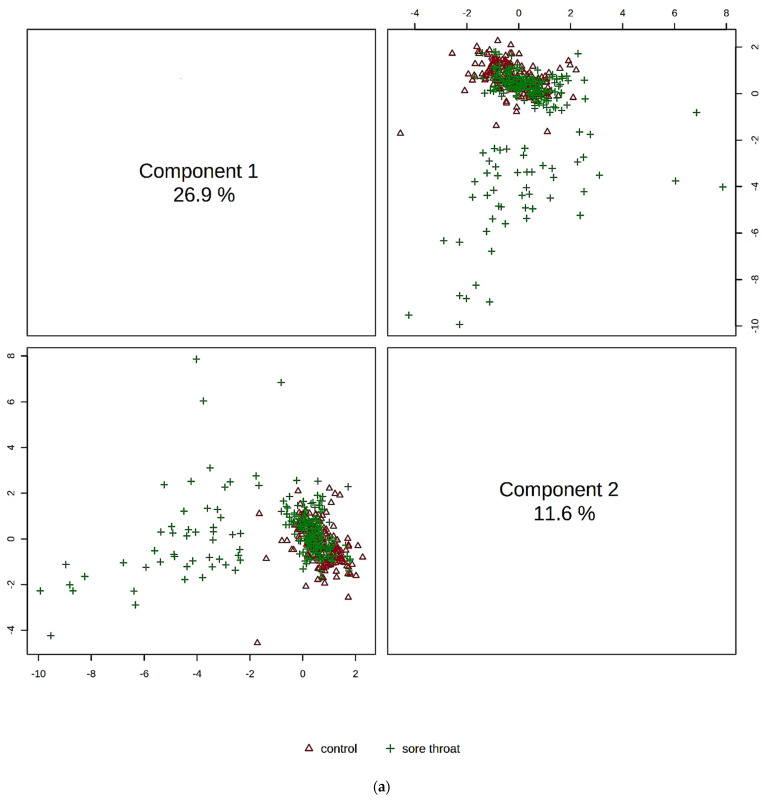
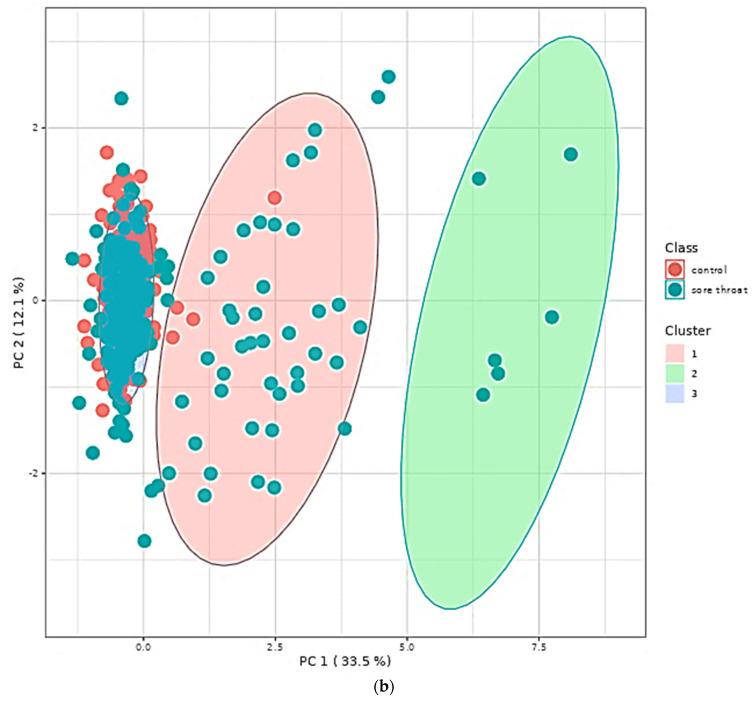
Figure 7.
(a) Further segregation of the factor analysis (FA)-defined host source metabolite PC1 component (Ref. [1]) into two sub-components of 10 variables each via a secondary sPLS-DA strategy: PC2 versus PC1 and PC1 versus PC2 two-dimensional (2D) scores plots of results arising from this analysis of the acute sore throat disease dataset, with n = 480 participants (240 sore throat-positive, 240 age-matched healthy controls) and 31 1H NMR-assigned biomolecules. Model 2 variance contributions for PC1 and PC2 were 26.9 and 11.2%, respectively. (b) PC2 versus PC1 2D scores plot of a composite PCA/k-means clustering analysis applied to the full Model 1 1H NMR ISB dataset (183 variables in total). Estimated variance contributions for PC1 and PC2 were 33.5 and 12.1%, respectively.


