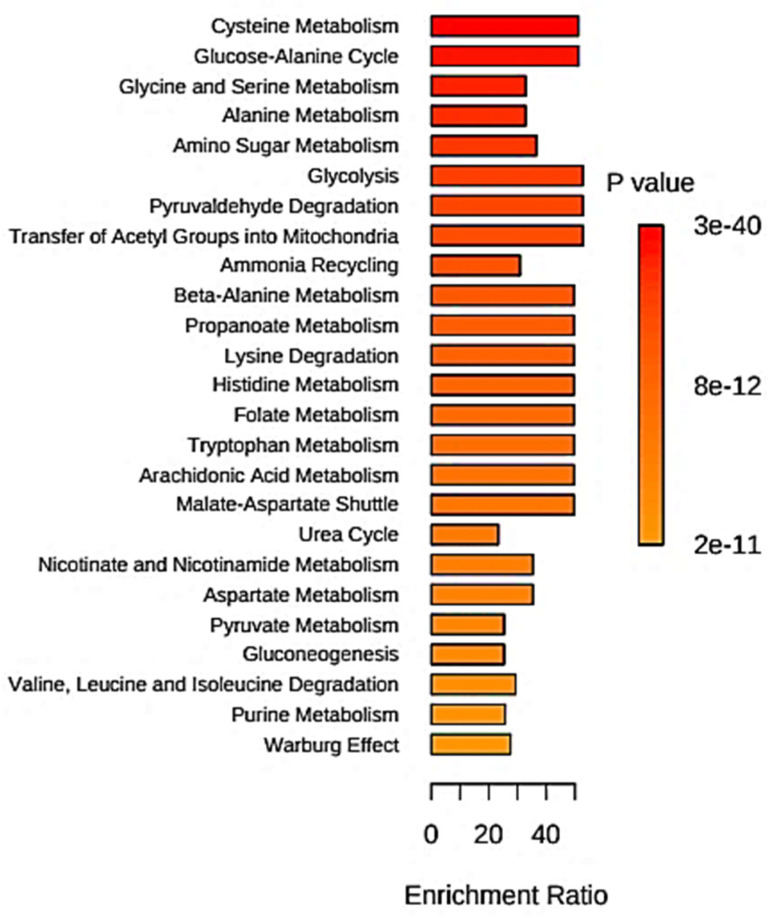
Figure 8.
Overall summary plot for Quantitative Enrichment Analysis (QEA) performed on human host-contributory salivary metabolites, showing enrichment ratios and corresponding p values for the top 25 metabolic pathways which are indicated as being the most highly dysregulated for humans affected by an acute sore throat condition. QEA was performed using the globaltest package option [88], which employed a generalized linear model to estimate Q statistics for metabolite sets; such Q statistics represent correlations between metabolite concentration profiles (predictor X variables) and the clinical outcome (Y variable). The Q statistic provided for a metabolite set represents the mean value of the Q statistics for each metabolite within that set. The small molecule pathway database (SMPDB) metabolic pathway-associated metabolite sets consisted of 99 entries.

