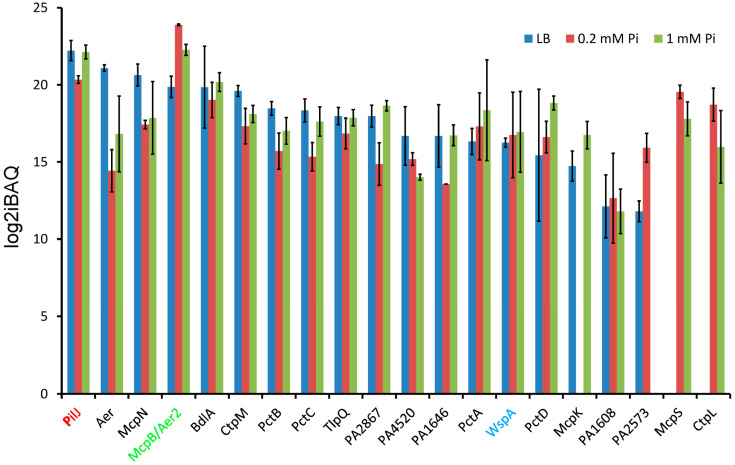
Figure 3.
Chemoreceptor protein amounts in P. aeruginosa PAO1 grown in LB medium or minimal medium with 0.2 mM and 1 mM Pi. Chemoreceptors were ordered according to their protein amount in LB. Chemotaxis chemoreceptors are shown in black, whereas the chemoreceptors that stimulate the Chp, Che2, and Wsp pathways are shown in red, green, and blue, respectively. Error bars indicate standard deviations from the mean intensity Based Absolute Quantification (iBAQ) index.

