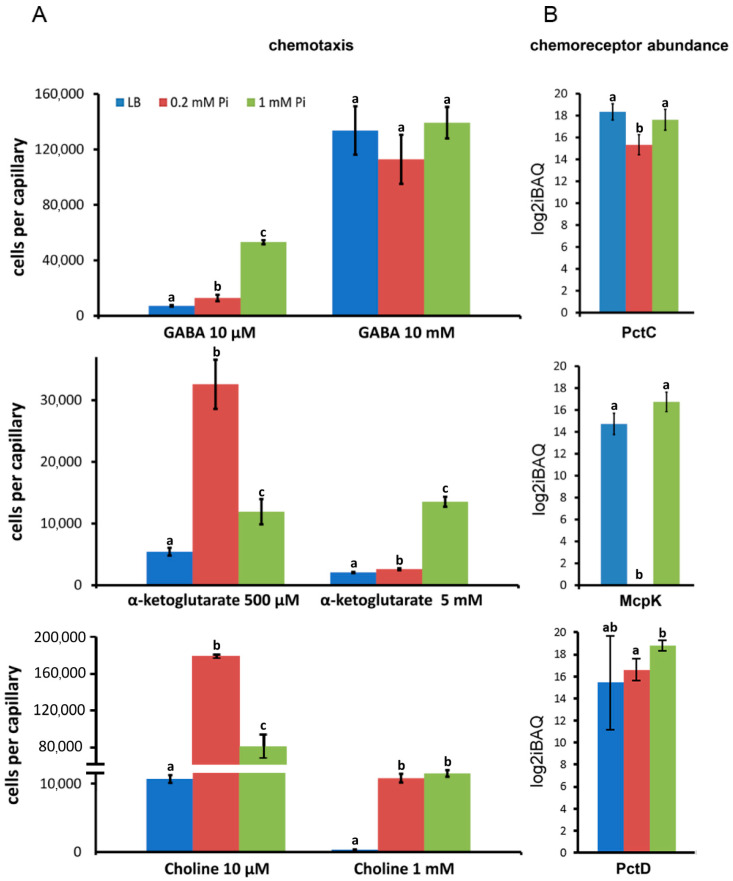
Figure 4.
Relationship between the magnitude of chemotaxis and the cellular abundance of the corresponding chemoreceptors. (A) Quantitative capillary chemotaxis assays of P. aeruginosa PAO1 to GABA, α-ketoglutarate, and choline. Cells were grown the same way as for the proteomics analyses [49]. Responses have been corrected with the number of cells that swam in buffer-containing capillaries, namely 7350 ± 3850 (GABA), 6400 ± 2667 (α-ketoglutarate), and 7500 ± 3500 (choline). (B) Cellular protein amounts of the PctC, McpK, and PctD chemoreceptors in P. aeruginosa PAO1 grown under the conditions used for the chemotaxis assays. Differences between bars with the same letter are not statistically significant (p-value < 0.05; by Student’s t-test).

