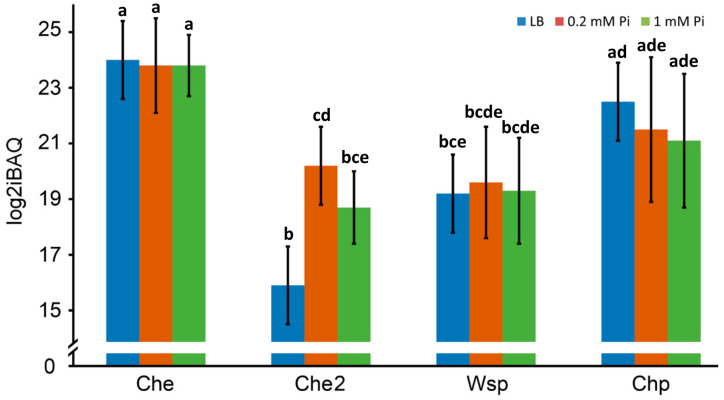
Figure 7.
Mean abundance of the signaling proteins that form the 4 chemosensory pathways in P. aeruginosa PAO1. The values correspond to the sum of each of the proteins that were quantified under each experimental condition. Differences between bars with the same letter are not statistically significant (p-value < 0.05; by Student’s t-test).

