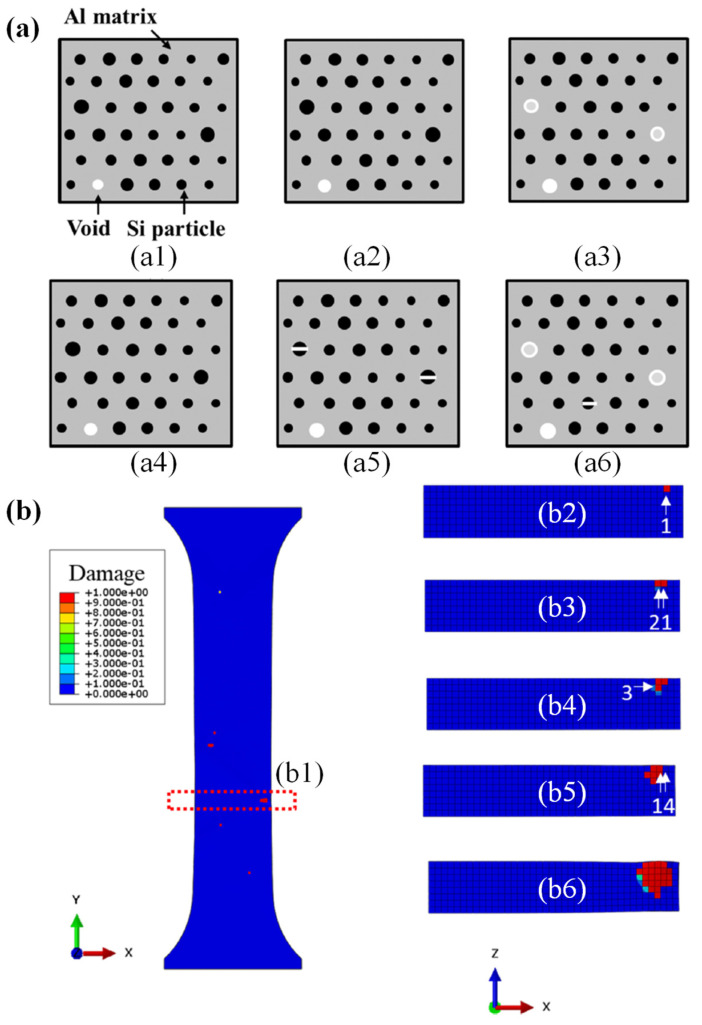
Figure 4.
A schematic description of coupling numerical simulation with fracture model to predict internal cracks. (a) The damage evolution at the material point: (a1), (a2) and (a3) are the start of time step increment; (a4)–(a6) are the post-time steps of (a1), (a2), and (a3), respectively. (b) The damage value contour of simple tension simulation: (b1) shows the whole model in the X–Y plane, and (b2)–(b6) shows damage propagation in the Z–X plane through time at the red marked region in (b1). Reproduced with permission [24]. Copyright 2022, Elsevier.

