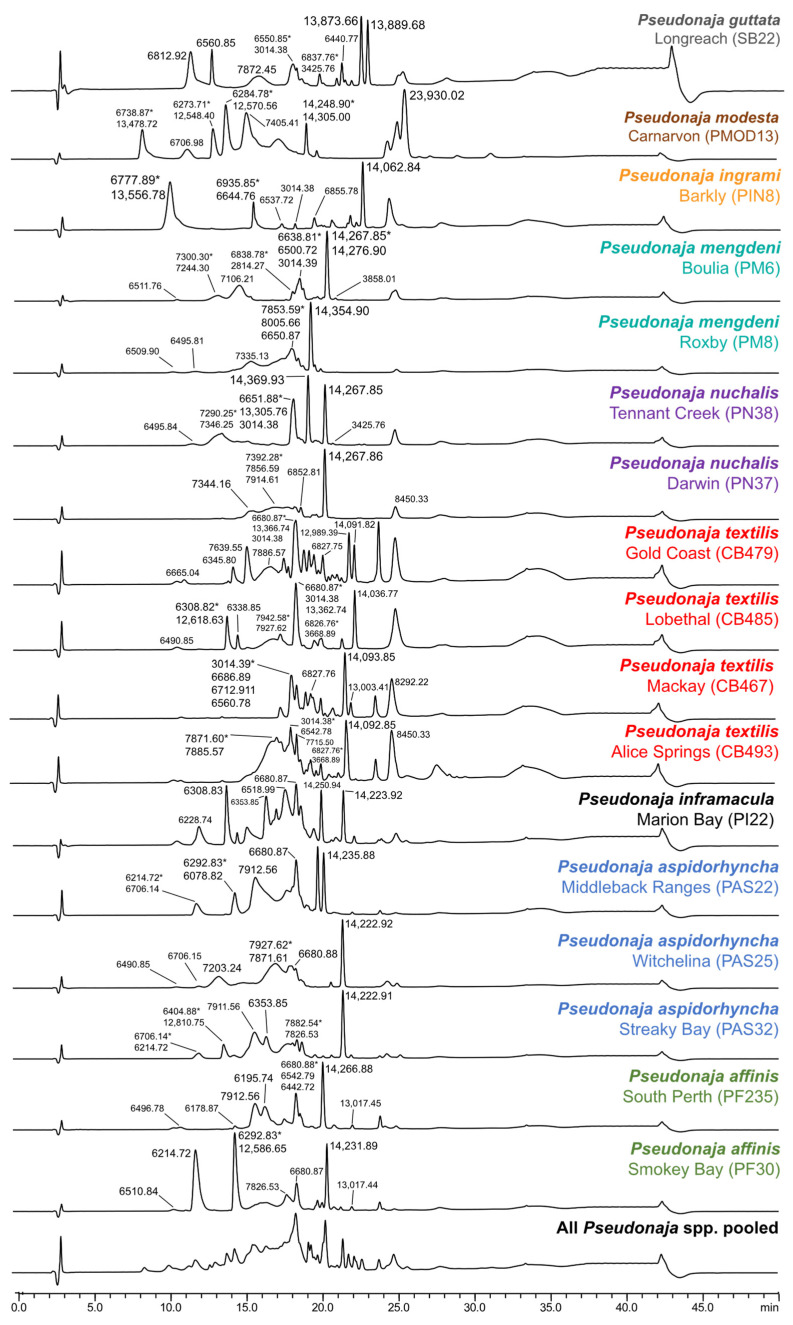
Figure 3.
Comparative LC-UV (220 nm) measurements of brown snake (Pseudonaja spp.) venoms. Peaks indicate the relative protein abundance and show the corresponding masses (Da) identified using the in-parallel acquired mass spectrometry measurements. The mass with the highest MS-intensity is indicated by an asterisk (*). The pooled sample consists of all individual brown snake venoms.

