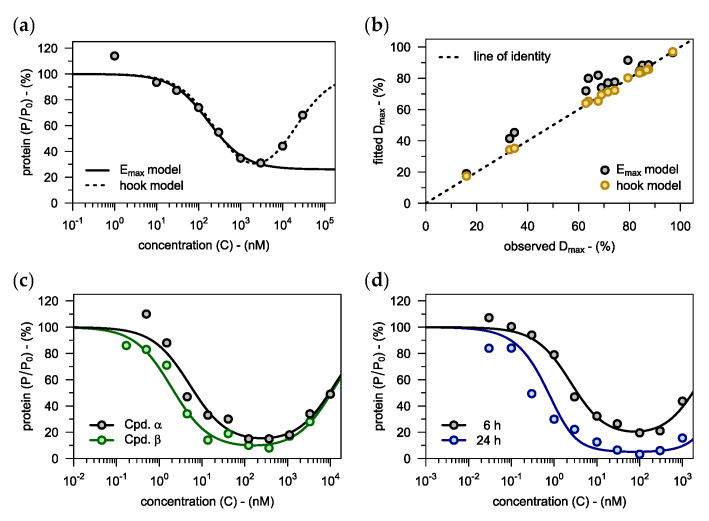
Figure 3.
(a) Relative levels of target protein are plotted against PROTAC concentration in media (i.e., concentration-degradation profile). For comparison, both the hook model presented here as well as the conventional model are fitted to the data (see Figures S1 and S2 for further examples). When fitting the model, only concentrations below the concentration of maximal degradation were considered. (b) A total of 17 concentration-degradation profiles were described using both the hook model and the model. The resulting estimates for the maximal extent of degradation () are plotted against the respective experimentally observed values. Experimental data (a,b) taken from Zorba et al. [21]. (c) The hook model is applied to reversible covalent (Cpd. α) and irreversible covalent PROTACs (Cpd. β). Data taken from Gabizon et al. [22]. (d) Protein levels after 6 h of incubation as well as levels after 24 h are plotted against the concentration of the non-covalent PROTAC Cpd. Y. The extended hook model (Equation (14)) is fitted to the concentration-degradation data from the 6 h time point, which then allows to predict degradation after 24 h. The experimental observations for the 24 h time point confirm that prediction. Data taken from Mares et al. [23].

