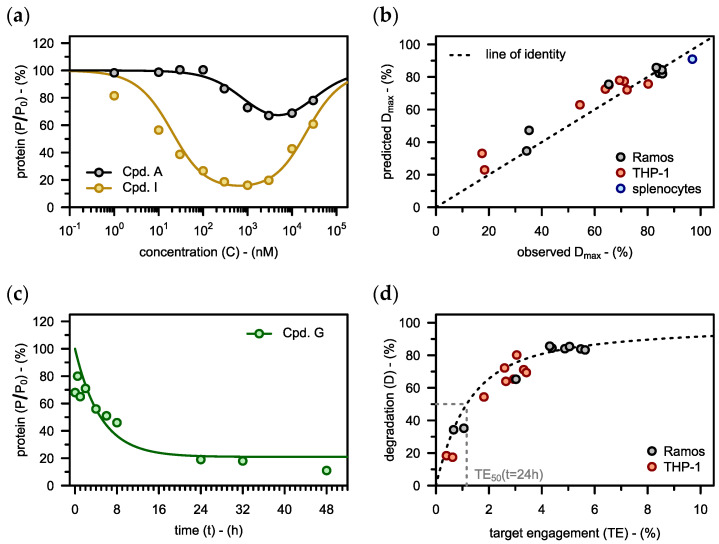
Figure 4.
(a) The rate constant of PROTAC-catalyzed protein degradation is fitted to the concentration-degradation profile observed for the lead compound (Cpd. A) in Ramos cells (). This is the only parameter in this figure that was derived by model fitting. Subsequently, the model is used to predict, what binding affinities would give the orange profile. The optimized compound (Cpd. I), which features the binding affinities suggested by the model (see Table S1), exhibits the desired concentration-degradation profile. (b) Based on the value from Cpd. A and the biochemical input data (Tables S1 and S2), the maximal extent of degradation () is predicted for different compounds in different cell types. These predictions are plotted against the estimates for obtained by characterizing the respective experimental concentration-degradation profiles with the hook model (see Figure 3b). There is good agreement between the predicted and the observed values, as indicated by Pearson’s correlation coefficient (). (c) The time-course of degradation in Ramos cells following incubation with Cpd. G () is predicted using the value from Cpd. A. (d) The maximal extent of degradation () observed for the nine compounds from before is plotted against the respective target engagement () values calculated using Equation (3). Equation (15) predicts a hyperbolic relationship (). Experimental data (a–d) taken from Zorba et al. [21].

