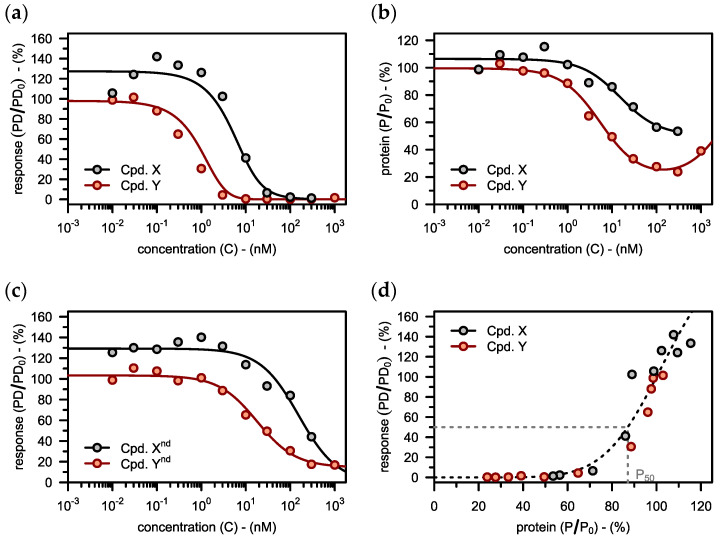
Figure 5.
(a) The model is fitted to data on the downstream pharmacodynamic response (TNF-alpha levels) in the presence of various concentrations of the lead compound (Cpd. X). This analysis yields the target protein levels of half-maximal pharmacodynamic response () and an empirical hill coefficient (). Subsequently, a target profile is defined for a potential follow-up compound (Cpd. Y). (b) Target protein levels (RIPK2) are plotted against drug concentration. The model is used to predict the target concentration-degradation profile for the follow-up compound from before (Cpd. Y). (c) The downstream pharmacodynamic response (TNF-alpha levels) is plotted against the concentration of the corresponding non-degrading (nd) control compounds. (d) The observed TNF-alpha response is plotted against the corresponding RIPK2 levels for both compounds. The dashed line shows the fitted model from before, but this time explicitly neglecting inhibition (). Experimental data (a–d) taken from Mares et al. [23].

