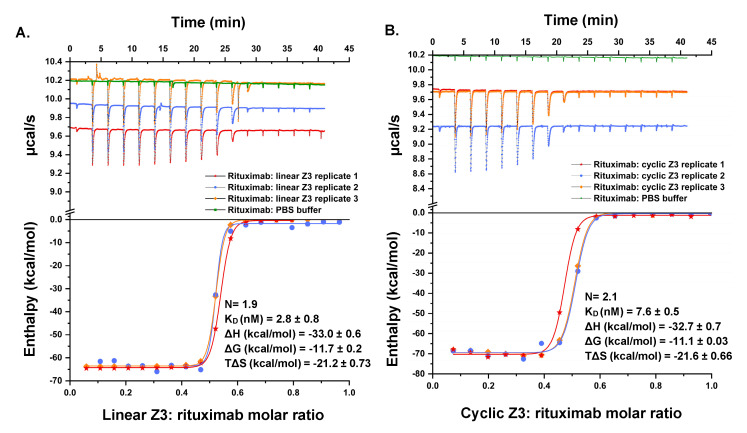
Figure 9.
Titration calorimetric characterization of the interaction between rituximab and Z3 protein variants. (Top) Raw data of the sequential titration of (A) 40.3 μM linear Z3 into 8.0 μM rituximab in the sample cell and (B) 48.1 μM cyclic Z3 into 7.6 μM rituximab in the sample cell. (Bottom) B integrated heat of titration as a function of the molar ratio of Z3: rituximab. The standard error was calculated from three independent measurements.

