Figure 2.
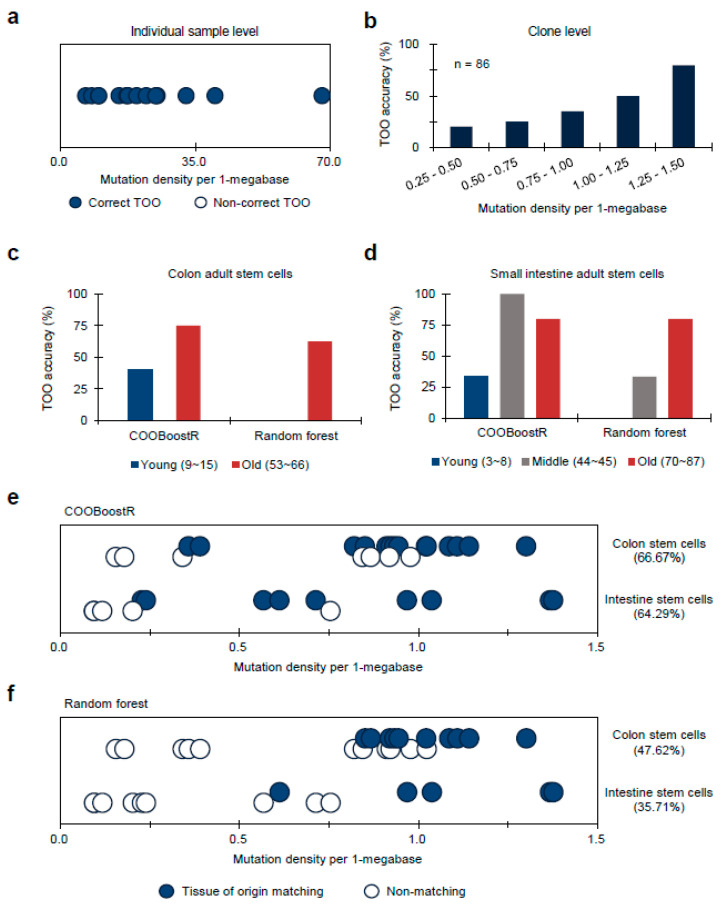
TOO prediction accuracy for normal stem cell organoids or tissue samples harboring low mutation density (average mutation density for stem cell organoids: 0.73, liver tissue clones: 0.63). (a) TOO prediction accuracy for normal liver at individual sample level. Samples are aligned in order of mutation density magnitude per 1-megabase window after classifying the correctness of TOO prediction. Dots were jittered to dissect out the blue and white dots. (b) TOO prediction accuracy for normal liver at clone level. Histogram showing TOO prediction accuracy of liver clones with respect to the mutation density groups. (c) TOO accuracy comparison for colon adult stem cells according to age-based subgrouping between COOBoostR and Random forest-based algorithm. (d) TOO accuracy comparison for small intestine adult stem cells according to age-based subgrouping between COOBoostR and Random forest-based algorithm. (e,f) TOO prediction accuracy for colon and intestine stem cell organoids at an individual sample level using COOBoostR (e) or Random forest-based algorithm (f). Samples matching predicted TOO are marked with solid circles, and samples that did not match are marked with empty circles. Dots were jittered to dissect out the blue and white dots. Samples are aligned in order of mutation density magnitude per 1-megabase window.

