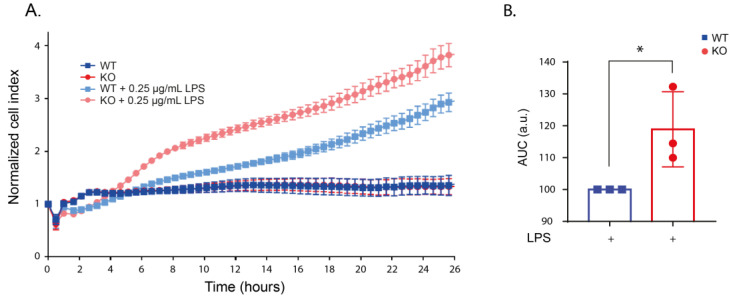
Figure 2.
LPS stimulation altered the morphology of KO cells. (A) Representative real-time impedance measurement of the WT and KO cells with and without 250 ng/mL LPS stimulation using xCELLigence system. (B) Bar graph showing the area under curve (AUC) of 3 independent xCELLigence measurements normalized to the LPS-stimulated WT cells. t-test was used to deduce significant differences. Error bar represents mean ± SD. Significance is defined as: * p < 0.05.

