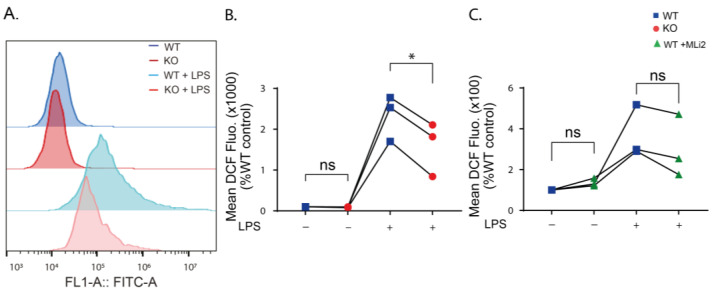
Figure 3.
Cellular ROS levels are reduced when LRRK2 is absent or its kinase function is inhibited. (A) Histogram showing representative FACS sample analysis of WT and KO cells with and without LPS stimulation for 24 h using DCFDA. (B) Analysis of the mean DCF fluorescence in the KO cells without and with LPS stimulation normalized to the control WT. (C) Analysis of the mean DCF fluorescence in the MLi2-treated WT cells without and with LPS stimulation normalized to the control WT. The experiment was performed 3 times and one-way ANOVA was used to compare the mean DCF fluorescence relative to the control WT. p-values indicating statistically significant differences between the mean values are defined as follows: ns—not significant, * p < 0.05.

