Figure 6.
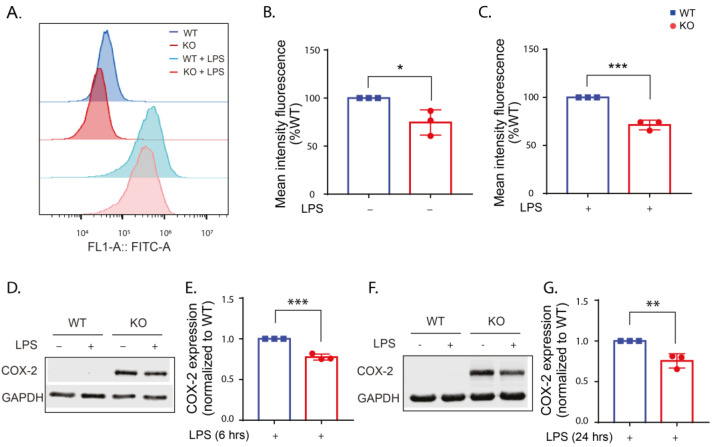
COX-2 is reduced in the KO cells with and without LPS stimulation compared to the WT. (A) Histogram showing representative FACS sample analysis of WT and KO cells with/without LPS stimulation for 24 h. (B,C) Analysis of the mean FITC fluorescence (representing COX-2 expression) in the WT and KO cells normalized to the corresponding WT. (D,F) Representative Western blots for lysates from WT and KO cells with and without LPS stimulation for 6 (D) and 24 (F) hours and immunoblotted with COX-2 antibody and GAPDH antibody as a loading control. (E) Fold change in COX-2 expression in the KO cells normalized to the WT calculated for 6 h LPS stimulation and (G) 24 h LPS stimulation. The experiments were performed 3 times and t-test was used to compare COX-2 expression in the KO cells normalized to the WT. Error bar represents mean ± SD. p-values indicating statistically significant differences between the mean values are defined as follows: * p < 0.05, ** p < 0.01, *** p < 0.001.

