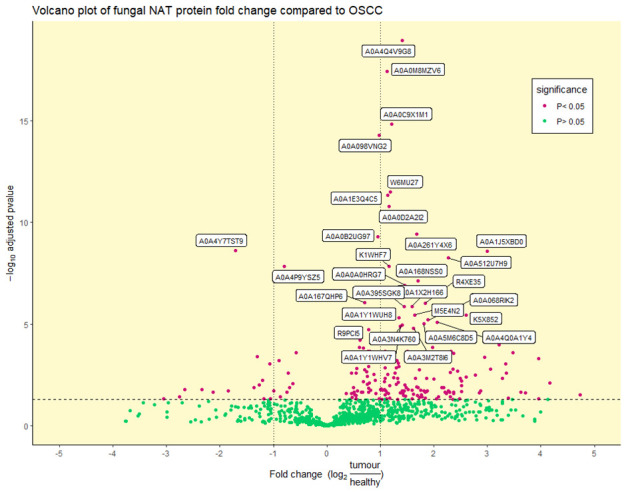
Figure 3.

Volcano plot of differentially abundant fungal proteins: Differentially (purple) and non-differentially (green) abundant fungal proteins between OSCC and NAT patient samples (adjusted p-value < 0.05) determined by statistical t-testing using Benjamini–Hochberg correction. The log2 fold change reflects the ratio of normalised TMT-label intensities between tumour OSCC and healthy NAT conditions. The horizontal dotted line represents an adjusted p-value of 0.05. Vertical dotted lines represent ± 1 log2 fold change. UniProt accession numbers are shown for the top 30 most significant proteins.
