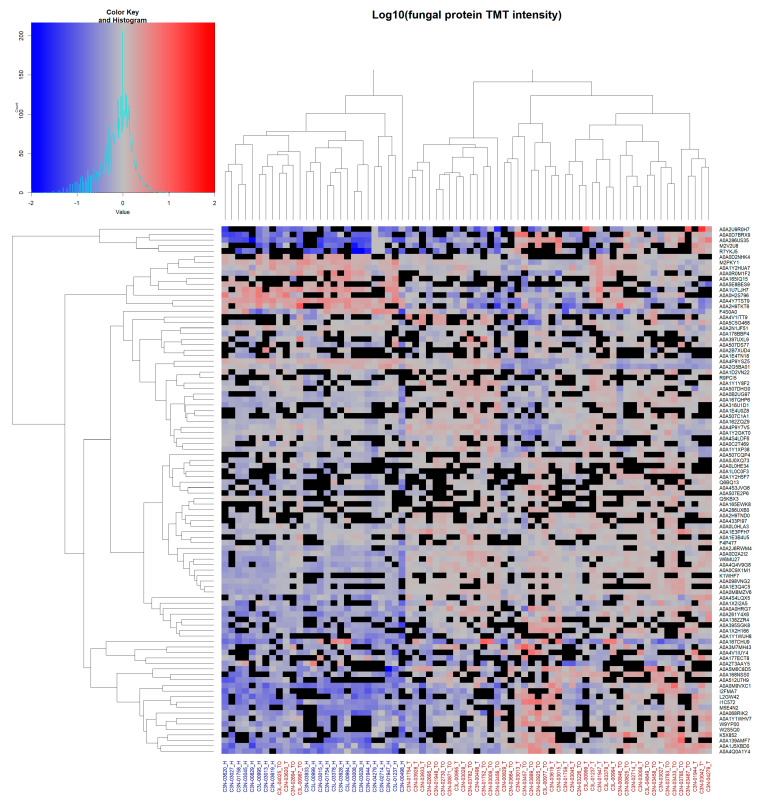
Figure 4.
Unsupervised hierarchical clustering of fungal protein data: Unsupervised clustering of fungal proteins observed in ≥24 total patient samples. Complete linkage clustering was used with Euclidean distance measures. Cells show log10-normalised TMT-label intensity with blue and red indicating reduced and increased intensity, respectively, relative to the experimental reference sample. Black cells indicate missing values. Column labels represent either healthy NAT (blue labels) or tumour OSCC (red labels) patient samples. Protein UniProt accession numbers are shown for each row.

