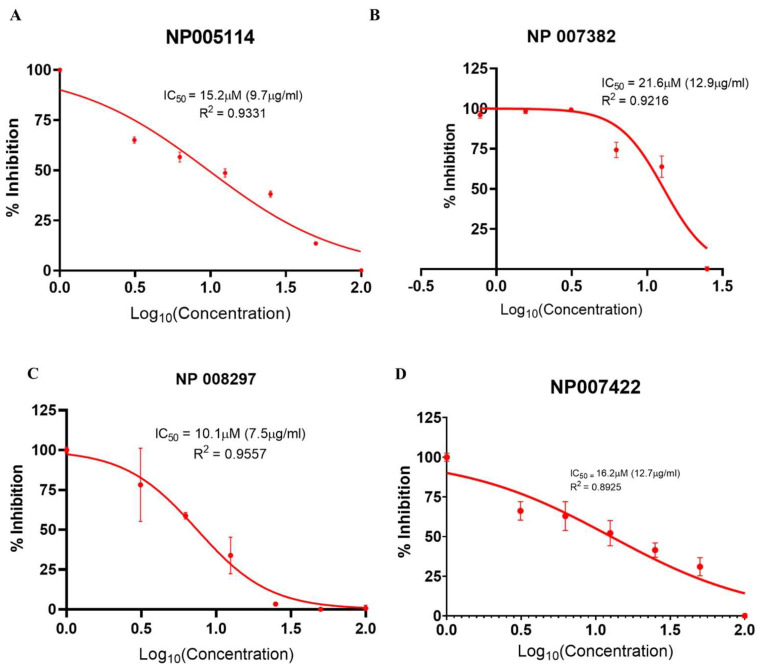
Figure 7.
Cell-based viral infectivity inhibition assay. Nonlinear regression plot of percentage inhibition (response) against the Log10 of compound concentration (dose) at a 95% confidence interval. (A) NP-005114 had IC50 of 15.2 µM (9.7 µg/mL), (B) NP-007382 had IC50 of 21.6 µM (12.9 µg/mL), (C) NP-008297 had IC50 of 10.1 µM (7.5 µg/mL), and (D) NP-007422 had IC50 of 16.2 µM (12.7 µg/mL). Error bars represent the standard error of the mean (SEM) of triplicate wells.

