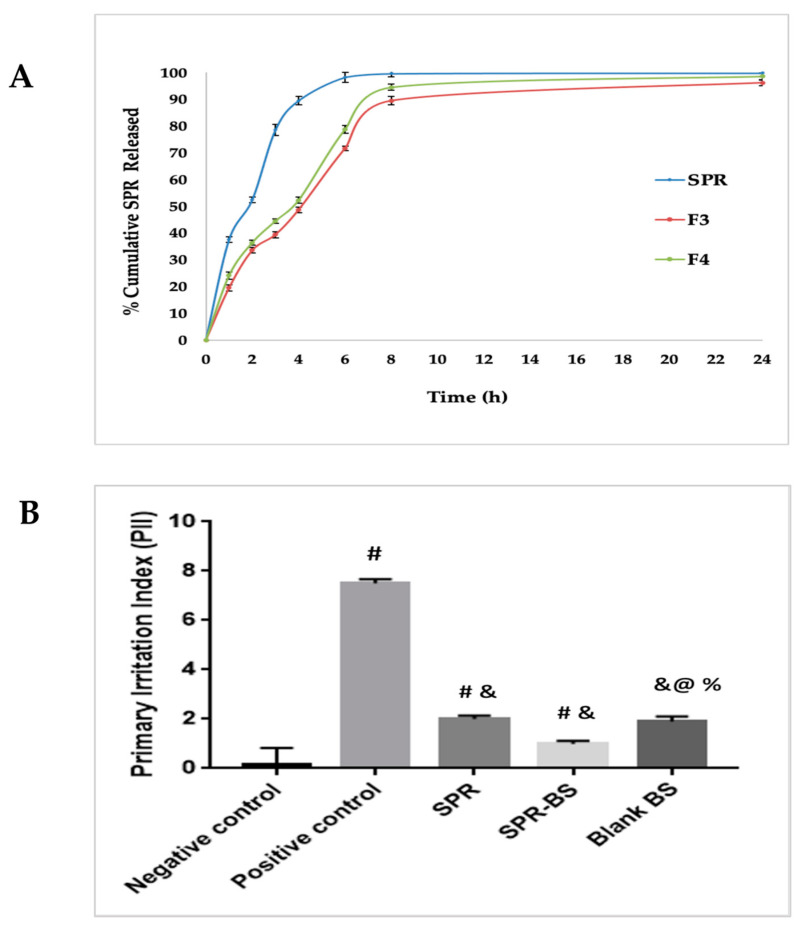
Figure 2.
(A) Cumulative percentage SPR released from SPR and SPR BS. (B) Primary irritation index of different experimental groups in Draize method. Values are represented as mean ± SD. # significant from negative control group. & Significant from positive control group. % Significant difference from blank BS. @ significant from SPR group. Significant difference was conducted at p < 0.0001.

